
A Top Investing Newsletter.
Don’t miss our invaluable research and winning stock ideas!
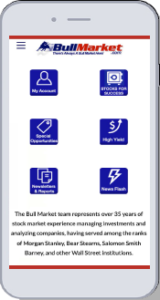
The Bull Market team represents over 55 years of stock market experience managing investments and analyzing companies, having served among the ranks of Morgan Stanley, Bear Stearns, Salomon Smith Barney, and other Wall Street institutions.

A Top Investing Newsletter
Don’t miss our invaluable research and winning stock ideas!
The Bull Market team represents over 55 years of stock market experience managing investments and analyzing companies, having served among the ranks of Morgan Stanley, Bear Stearns, Salomon Smith Barney, and other Wall Street institutions.
Subscriber Testimonials
A Powerful Investing Newsletter
The Bull Market Report includes a bi-weekly Financial Newsletter, market commentary, new stock ideas, in-depth stock research and analysis, and updates on our ten portfolios (65+ stocks) including STOCKS FOR SUCCESS, Special Opportunities, Early Stage, Financial, Healthcare, Long Term Growth, Real Estate Investment Trust, Energy, High Technology and High Yield. Also, you will receive Special Reports and News Flashes on important developments on our stocks. Don’t miss our invaluable stock market research and winning stock picks! It is our goal to build wealth for you and your family.
UNDECIDED?


What are subscribers saying?
"Five consecutive days of robust gains to my portfolio!! I am seriously considering nominating the entire Bull Market staff for sainthood. Thanks for coming to my rescue. You have exceeded expectations. Many thanks from me, my heirs and assigns."
Richard Lew, Scottsdale Arizona
Investment Newsletter Benefits
![]() The Bull Market Report:
The Bull Market Report:
Conveniently sent to your email inbox bi-weekly, The Bull Market Report includes actionable market commentary, new stock ideas, in-depth stock research and analysis, and updates on the 65+ stocks in our STOCKS FOR SUCCESS and nine other portfolios.
![]() News Flashes:
News Flashes:
Receive emails from time to time during the week on material news about any of our recommended stocks.
![]() Recommended List of Stocks:
Recommended List of Stocks:
Get exclusive access to STOCKS FOR SUCCESS across all major industries, including financials, Healthcare, Energy, Retail and Technology, as well as High Yield Stocks.
![]() Special Reports:
Special Reports:
Receive Special Reports from time to time, primarily on Technology and other High-Yield stocks.
![]() Fully Searchable Archives:
Fully Searchable Archives:
Quickly find past analysis and insights on all current and previous Recommended List stocks, plus coverage on literally hundreds of other stocks The Bull Market Report has commented on and investigated.

Experience The Bull Market Report mobile app!
Our mobile app allows you to keep our EXCLUSIVE portfolios, research, News Flashes, and of course our popular Newsletter, all in the palm of your hand. Any Bull Market subscriber can download the app from the Apple iTunes Store or Google Play. Either click one of the buttons below or search "Bull Market" in your app store.

Attention Financial Professionals
 Are you in the finance industry? We offer Enterprise Subscriptions so you can make The Bull Market Report and research available to your employees, or even to your customers as an added benefit! Find out how by contacting our Editor, Todd Shaver.
Investing in Knowledge will fetch you the Best Interest
Want to beat the market like Warren Buffet and Benjamin Graham?
Well, finding best yielding stocks require focus, discipline, and most significantly, proper homework. But don’t worry; Bull Market will take those steps out of the equation for you!
Bull Market: Who we are?
We are a top Investing Newsletter. Our 55 years of stock market experience in managing investments and assessing companies makes us stand out from rest of the best newsletters in evaluating:
- Best stocks to invest in
- Best yielding stocks
- High dividend stocks to buy
- Winning stock ideas
The Bull Market Report is comprised of a bi-weekly Financial and Stock Newsletter, market insights, new winning stock ideas, detailed stock research and analysis together with the updates on our 10 portfolios including -
- Stocks for Success
- Special Opportunities
- Early Stage
- Healthcare
- Energy
- Financial
- Real Estate Investment Trust
- Long Term Growth
- High Technology
- High Yield
Our invaluable research and winning stock ideas make use of a sophisticated ranking system to spot high-end companies trading at reasonable prices, and then provide a detailed qualitative and quantitative report on each recommendation. Stock newsletters have been around for decades, but questions around their usefulness have always surfaced. We at The Bull Market Report examine different types of investment and stock ideas and bring you just 65 or so recommendations. Any more than this is just too much information to comprehend. We are specialists and have a proven, successful track record to back us up.
Why Choose Bull Market?
More than a million people subscribe to the best newsletters, but it’s a Wall Street area that doesn’t get access to a lot of advice and scrutiny. With Bull Market, you receive access to the latest trends and other notable happenings in the business world through its stock newsletters. Bull Market particularly has a strong understanding of the stock market and is well-known for its concise method of keeping its readers well-informed and pro-active.
Benefits of Bull Market Investment Newsletters
- The Bull Market Report - This report is conveniently sent to your mailbox via email bi-weekly. It includes applicable market insights, winning stock ideas, best stocks to invest in, and updates on the 65+ stocks in our Stocks for Success and nine other portfolios.
- Recommend List of Stocks - You get exclusive access to Stocks for Success across various industry verticals, including Finance, Healthcare, Retail, Energy and Technology, as well as High Yielding Stocks.
- Special Reports and New Research - You will receive Special Reports and New Research Reports, on Technology, High-Yield Stocks, and other important areas of investment.
- Completely Searchable Archives - You can quickly walk through our past investment ideas and get insights on all of our past and present Recommended List Stocks.
Still not convinced? Reach out to us and we can show you that the impossible can be done! Click on the Contact Us button just below to write to Todd Shaver. He will get back to you within 24 hours. Guaranteed.