by Scott Martin | Apr 13, 2025 | Weekly Newsletter 7pm Sunday
The Bull Market Report
Probably the Best Financial Newsletter in the Country
Market Summary
After teasing a possible special edition of The Bull Market Report last week, we'd like to give you a little insight on what we've seen in the market and how investors can position themselves. So here we are. The mood remains extremely anxious, especially with Treasury bonds selling off contrary to the conventional wisdom where money flows into the safety of U.S. government debt when the economic outlook gets gloomy. While we aren't exactly shocked (correlations between stocks and bonds have gotten tighter in recent years than a lot of now-outdated textbooks taught), it can be harrowing to watch all major U.S. asset classes go over a cliff. Even the dollar is on the run, down 11% from its recent peak and circling lows last seen in the 2022 bear market.
But cut through the surface turmoil and the signs of resilience are clear. The volatility index or "VIX" is still extremely elevated, but dropped 23% last week as investors shook off the initial tariff shock. If the initial announcement had been as toxic as the market reaction suggests, the economy would already have collapsed and we would not be here talking about stocks. That's a lot better than a catastrophic worst-case scenario. Furthermore, developments in the past couple of days prove that trade policy isn't inflexible nor an ultimatum. Instead, there's a lot of room here for negotiation and compromise: timelines can be extended to give corporate leadership more time to react, some essential import categories can receive favorable treatment, and so on.
We've already seen tariffs on most countries delayed for 90 days, which gives purchasing managers until July to pivot their supply lines to the countries with the best odds of making a deal that works. And just over the weekend, we've seen tariffs on semiconductors and other computing components pulled back for adjustment, which takes the pressure off companies like Apple and Nvidia for the time being. Granted, the threat of additional trade barriers remains real. But the prospect for relief is real also. Right now, relief is winning. The trade war may be painful but at least it wasn't immediately fatal.
And stocks that were priced for the end of the world now look worth buying. Major benchmarks exploded on Wednesday when the 90-day pause was announced, with many of our stocks leading the way back. Our Early Stage recommendations, as small and theoretically vulnerable as they are, rebounded close to 30% in the last three trading days. On the other end of the market scale, giants like Apple, Amazon and Microsoft have recovered 8-10% from their lows while Nvidia bounced 15%. We could keep listing names (Meta, Broadcom, Reddit, Dell, Duolingo, Zscaler, Palo Alto Networks) but the deeper message is as simple as it gets: when 80-90% of all stocks move hard in the same direction, all that's required to get 80-90% of all stocks moving in the other direction is for the Wall Street tide to change.
That's what happened here. We are not exactly swimming in calm waters by any means, but the waves went our way this week. Money will likely keep flowing out of the bond market. Where will it go? We suspect a significant amount of capital will come back to stocks, which may be volatile but offer investors hope for better than a 3-5% return in the long run. Capital will also park in the ultimate safety of gold, where our SPDR Gold Shares (GLD) remains a real bulwark of our overall coverage universe. It's good to have a hedge when the world gets unsettled. Gold is the place.
Meanwhile, earnings season is underway, with the banks giving us pretty good numbers on Friday. JP Morgan and Citgroup don't see an immediate disaster unfolding. While we're early in the season, warnings and negative guidance revisions are NOT multiplying at too fast a speed yet. Executives might not like watching their supply chains and manufacturing costs get tangled, but they aren't surrendering either. They're fighting hard. And they think they have a handle on the situation. If they didn't, they'd warn us now and look like heroes in three months when they beat their own pessimistic forecasts.
The next few months will remain volatile, with bond yields back where they were two months ago and the VIX well above "normal" no matter where you draw the statistical boundaries. But at this stage, corporate earnings will probably come in 7% higher this quarter than they were a year ago and the growth trend still points up into 2026 and beyond. Remember, profit margins are relatively high by historical standards, so there's room for a shock or two without rocking the comparisons too much. And remember that interest rates have dropped significantly in the past year, with the Fed poised to cut again on any sign of economic damage more threatening than persistent inflation. Lower short-term rates are supportive. They're a net positive. And we don't recommend Treasury bonds here, so higher long-term rates are not our problem and should not be yours either.
What we're left with is an environment where 70% of the stocks in the S&P 500 are in correction territory and a full 40% are in the grip of a fresh bear market. Apple, Alphabet and Amazon are down 24% from their recent peaks. Nvidia and Meta are down 27%. And the list of great stocks at depressed levels goes on, both on the BMR buy lists and in the broader market. Walmart down 12%. ExxonMobil down 19%. Classic "defensive" names like Johnson & Johnson down 11%. This is classically an entry point, a chance to buy quality at a deep discount, provided that you aren't convinced that the world is about to end. Wall Street has faced every crisis that history could throw at it so far and gone back to breaking records. This time is no different.
Key Market Indicators
Good Investing,
Todd Shaver, Founder and CEO
The Bull Market Report
Since 1998

by Scott Martin | Mar 23, 2025 | Weekly Newsletter 7pm Sunday
The Bull Market Report
Probably the Best Financial Newsletter in the Country
IN THIS ISSUE
Market Summary
The Big Picture
Netflix
C3.ai
VanEck Semiconductor ETF
Zscaler
Dexcom
iShares Oil & Gas Exploration & Production ETF
Range Resources
Ally Financial
Welltower
The Bull Market High Yield Investor
- Invesco Municipal Trust
Market Summary
We'll count this as a win. While our stocks still have a little ground to recover before we wipe out the last YTD losses and start moving forward again, at least we've started moving fast in the right direction. Broad market benchmarks, on the other hand, still look more than a little stalled, with the S&P 500, Nasdaq and Dow Industrials down 2-3% from where they were two weeks ago. What's changed in the world? Not much at all. Trade policy remains unsettled, the Fed is still on hold and earnings season is effectively over until the next cycle gets underway in mid-April.
However, the recent "flash correction" (seventh-fastest in history, we're told) managed to attract buyers back to a market that felt slightly overpriced relative to the amount of uncertainty out there. A few months ago, investors seemed confident holding onto stocks valued at 22X earnings. Now, while the outlook has weakened a little, investors seem willing to accept roughly 20X as a viable entry point. If that proposition holds in the longer term, this will go down in history as a bottom and not a hard ceiling on the market's ability to keep rallying despite all apparent threats.
After all, the collective corporate bottom line is not going down. It's only going up a little less fast than we hoped a few months ago. We'll talk about this in greater detail in The Big Picture but the executive summary really boils down to the fact that all the apparent threats haven't triggered any kind of earnings recession. All they've done is curbed the most enthusiastic growth forecasts. We're in more realistic territory now. And if investors will pull cash off the sidelines and pour it into stocks with the market at 20X, then that's the world we find ourselves in.
There are at least two key lessons here for BMR subscribers. First, our approach to diversification may superficially hurt us when the bulls are running at full froth, but the minute the market mood turns sour, a little extra exposure to income-oriented stocks and funds goes a long way. These investments rarely have a lot of growth on their side. The underlying businesses are steady cash generators but management is more focused on returning cash to shareholders than pouring it back into corporate expansion initiatives. As a result, while they're rarely sexy, they have a lot of staying power. Our Healthcare portfolio is up YTD. So are most of our REITs, most of our Financials and, in a shock to some, Energy. Yes, the Energy portfolio is up 5% YTD despite all the nattering about the world economy and falling oil prices. Never forget that in a true economic upheaval, it's strategically useful to have a stake in the companies that collectively keep the world's lights on and the trucks running. (We've been loving our SPDR Gold Shares for similar strategic reasons: up 15% so far this year!)
The second lesson is that over time the most dynamic companies will outperform. They rally harder in the good phases and while they might correct almost as hard in the downswings, you just can't keep a good stock down. The rebounds are more robust than the retreats. In some cases, you can't even see the retreat. We're pleased to have names like Netflix (up 8% YTD), Meta Platforms (up 11%, beating everything else in the "Magnificent 7") and Zscaler (up 16%) to both buoy our overall results and demonstrate our expertise. From cycle to cycle, having stocks like this on our list is how we keep outperforming.
Do the allocation math. We currently cover 55 stocks and funds. Unlike top-down passive portfolios, our "BMR Index" is equally weighted to allow smaller names the same shot at the spotlight as the giants. Otherwise, small stocks like Recursion Pharmaceuticals (market cap $2 billion) would vanish in the face of a single Apple ($3.8 trillion). They'd lose all their impact. Netflix accounts for about 1.4% of our equal-weight universe so its strength this year shows up a lot more clearly than it does in index funds that track the S&P 500, for example, which weight the stock at barely half that level. Zscaler, with a relatively lofty $31 billion valuation, doesn't show up in the index fund at all. Those investors are locked out of success stories like this until the stocks have already succeeded. Even then, it takes trillions to add up to more than the percentage point or so of attention we give every single recommendation.
Granted, the last few weeks haven't been kind to a lot of these companies and the rest of our recommendations have taken a significant step back. But we've always said that while Wall Street's moods come and go, the fundamentals always assert themselves as the ultimate arbiter of shareholder value. Or as Warren Buffett's mentor Benjamin Graham once said: "In the short run, the market is a voting machine, but in the long run, it is a weighing machine." The fundamentals remain robust. As long as that situation doesn't change, the votes should ultimately swing back in our direction.
That's how we outperform, with a strong defensive line against the storms and a stronger offense when the skies clear. Let the Fed do whatever it wants. Let Washington swirl. One way or the other, we're in position to ride the wave. And this week in particular, that edge shows up in our tangible results, both recent and YTD.
There's always a bull market here at The Bull Market Report. We've spent a lot of time looking back at trailing earnings reports lately, so it's past time we opened up The Big Picture to what investors actually need to know: our take on the future and whether that projection is bright enough to justify buying (and holding) stocks at this point. Since the Fed met, you can guess what The Bull Market High Yield Investor is all about. And as always, we need to update you on stocks in our favorite sectors.
Key Market Indicators
The Big Picture: Substance Over Shock
A packed news cycle has a lot of investors on edge. We get it. But in our experience, flinching from every hypothetical shock practically ensures that you'll miss out on a lot of opportunities, even if you're not a "trader" looking to sell out ahead of periods when stocks underperform or go down. After all, most of the nightmare scenarios we can imagine simply don't come true, and the ones that happen are rarely as bad as the worst projections suggest. Unless you can't roll with a few rumors, you'll find it challenging to reach for the upside.
And we're in luck because there's one news cycle we can always anticipate and the next one starts in a few weeks when the big Banks start to release their quarterly numbers. Unlike all the speculation about trade policy or taxes, for example, earnings season is a scheduled event. We can all see it coming. Most of the bigger companies let us know weeks in advance when exactly to expect the numbers. They also provide some sense of what to expect from the numbers, which is all "guidance" really means. Of course this advance glimpse at how the cash is flowing is not official or perfectly accurate, but it's the best sense the executives running the operation have of where the trends point.
While that logic might seem intuitive and even basic on the surface, it's worth letting it sink in through all the anxious chatter currently choking the market. Guidance gives us a pretty good sense of earnings, revenue and other key metrics for the current quarter and often the full year as well. At the very least, it's as good as the numbers the executives see every day as they guide the business around short-term threats and toward long-term goals. When something emerges as a real risk factor, they'll mention that they're watching it. If they don't volunteer that information, odds are extremely good that one or more of the analysts on the conference call will raise the question.
Those risk factors are built into every company's projections. When emergent threats have a material negative impact on those projections, a smart management team will acknowledge the pain early and warn Wall Street that the corporate sky has gotten cloudy. Normally somewhere between 55 and 65 members of the S&P 500 will issue this kind of warning at this phase of the quarterly cycle. We're currently tracking 66, which is only a fraction above average. Needless to say, "average" means normal. It isn't elevated. It isn't extreme.
Don't get us wrong: those warnings have a cumulative chilling effect. Our sense of earnings growth across the S&P 500 for the full year (2025) has come down about 3 percentage points in the last two months, which is roughly when the warnings started stacking up. Revenue growth is coming on 1/2 percentage point lower. This does not suggest that either the top or bottom line for America's corporate giants is going down, only that it is rising a little less fast than we hoped. All in all, we are still looking for 11% more profit this year than last and well above 5% higher sales numbers as well. Does that look like a looming crash to you? Remember, executives play a challenging game: when they guide our expectations lower, their stocks go down in the short term, but if they don't warn us at all, the stocks drop hard when we get the results. That's when the real "shocks" that matter happen.
We don't buy the S&P 500 as a whole, so all these numbers are really only relevant when it comes to gauging the overall market's mood. So who is feeling the chill? Materials producers are hurting hard. We don't recommend them. Tesla is hurting hard, with growth forecasts dropping as sales and sentiment falter. We don't recommend them right now either. The Industrials are reeling. Not a lot of that in our portfolios. Walmart warns? We don't cover it.
What we like (and what we overweight) is growth at the right price. That means a lot of Technology, a handful of Finance and Communications companies that effectively double as Tech and a surprising amount of Healthcare. Healthcare is booming, with earnings across the sector on track to expand 18% this year, right in line with traditional Tech. Some of these stocks have rallied so hard that they've gotten ahead of their realistic growth curves, but others have the dynamism to validate their valuations.
Here's the basic barometer: the S&P 500 might give us 11% growth this year and trades at 20X forward earnings. While that's not great by historical standards, it gives you a sense of what a vanilla "stock investor" would get in an index fund right now. Across the Tech sector, that growth rate might come in around 19% and Wall Street is paying 25X for that accelerated trajectory. Again, not great calculations by historical standards (back in the E.F. Hutton era, Tech would need to drop another 25% or so to qualify as a screaming buy) but not exactly bad enough to dump existing positions and start over. We'd call it a "hold" at worst. Healthcare looks much better at 18% growth and 17X forward earnings. Yes, that is that E.F. Hutton era "screaming buy," and it's why we are so happy with so many of our Big Pharma names.
Growth isn't everything, either. We have always preferred some sectors and industries (Real Estate, high-yield Financials and lately Energy) because they satisfy different investment criteria, the main one being the ability to lock in decent current income as the dividends accrue. Energy, as you know, is a boom-and-bust cycle. Right now these stocks are far out of favor with earnings stalled this year, but management feels comfortable forecasting 17% growth next year and we find no reason to disagree. At that point, Energy will be expanding faster than Tech. Investors who buy that story now at barely 14X current earnings will feel pretty smug in that scenario. That's exactly how all of this works. Buy clarity, don't flinch until it's clear that the bad headlines are actually headed into your lane.
BMR Companies and Commentary
Netflix (NFLX: $960, up 5% last week)
LONG TERM GROWTH PORTFOLIO
Streaming giant Netflix is riding high on the blockbuster success of its new tiers, content, and initiatives, and Wall Street, too, is taking notice with a string of bullish price targets in recent weeks. The most prominent take comes from MoffettNathanson which states rather definitively that ‘Netflix has won the streaming wars, case closed’ as its content and engagement metrics are miles ahead of competitors.
The stock released its fourth quarter results recently, reporting $10.3 billion in revenue, up 16% YoY, compared to $8.8 billion a year ago. Profits came in at $1.9 billion, or $4.27 per share, doubling from $940 million, or $2.11. We believe that the streaming giant’s profits are only just beginning to scale as it begins to unlock value from its massive worldwide landed base of 300 million paid subscribers.
The platform now reaches an audience of over 700 million viewers, or a little under a tenth of the world’s population, putting it right alongside the world’s top media conglomerates. The company’s much-publicized foray into advertising and its new powerful ad suite are all aimed at unlocking the billions in untapped value that comes from having so many eyeballs on you each evening.
The company’s relentless focus on engagement and customer satisfaction is paying off and is not slowing down. There was a time when its original content was hit-or-miss, but the company has finally cracked the content game and is now on par with the big studios such as Disney and Paramount. The move into live sports has flourished similarly in recent months, driving millions of fresh sign-ups.
Since the beginning of streaming play, Netflix's goal has been to have as many people spend as much time on the platform as possible. Having attained this goal, gears are shifting toward monetization. We expect advertising to become a major contributor to profits over the following months and years, in addition to several new content and pricing tiers.
In 2024, Netflix had more shows ranked #1 in the ‘Top 10 Streaming’ charts than the other streaming platforms combined. The Jake Paul vs. Mike Tyson boxing match last year was the most-streamed sporting event in history, and with the Christmas Day NFL Game, WWE Raw Pro, and the Screen Actors Guild Awards, it is now an entertainment powerhouse. Talk about streaming—Netflix’s profits will keep flowing in, and they’re already impressive, with $1.9 billion in profit on $10.3 billion in revenue.
Our Target for Netflix is a hefty $1300, and We Would Not Sell Netflix. We believe we have one of the highest targets on The Street. We can see a 10-1 stock split in the company’s future. Wouldn’t that be nice?

C3.ai (AI: $23, up 5%)
EARLY STAGE PORTFOLIO
Enterprise AI company C3.ai released its third quarter results recently, reporting $100 million in revenue, up 26% YoY, compared to $78 million a year ago. The loss during the quarter stood at $16 million, or $0.12 per share, against $16 million, or $0.13. Still, the company had a spectacular beat on consensus estimates at the top and bottom lines, giving investors renewed confidence in its future performance.
Subscriptions led the way at $86 million, up 22% YoY, followed by professional services at $13 million, a big 62% over the prior year. This was an eventful quarter for the company, with 66 new agreements, up 72% from the preceding year, made possible by its expanding global distribution network comprising several heavy-hitters in the cloud, AI, and professional services.
C3.ai signed 28 agreements spanning 9 industries via its partnership with Microsoft alone. It is now entering into similar partnerships with Amazon’s AWS and McKinsey QuantumBlack, which is focused on spearheading digital and AI transformation across large enterprises. The company realizes that such partnerships are key for seamless reach and execution at the leading edge of enterprise AI and tech.
We saw several new and expanded agreements from well-known brands during the quarter, including Sanofi, Nucor, ExxonMobil, and Coca-Cola. C3’s federal business continues to scale with similar agreements with the Department of Defense, US Air Force, the CAE USA, and the Missile Defense Agency, alongside 21 different state and local government wins during this period.
While investors remain concerned about the company’s persistent losses, profitability is approaching. Management aims to be profitable towards the end of 2026. In the meantime, we cannot ignore that this is one of the few companies to have succeeded with productized AI for large enterprises, which is bound to accrue value.
The markets, however, have been unable to look past the losses, with CEO Tom Siebel’s health issues* also weighing on their concerns. The stock is down 35% YTD, but we believe in this beaten-down speculative stock and its underlying tech platform. It has the resources to stay afloat till it turns profitable, with $720 million in cash and just under $5 million in debt.
*Siebel has been diagnosed with an autoimmune disease that is impairing his vision. The company has made specific accommodations, and he remains in charge of the day-to-day operations; however, when traveling for treatments, Jim Snabe, the former co-CEO of SAP and chairman of Maersk, Allianz, and Siemens, will be in charge. So, we know that things remain on course even as he battles this unfortunate condition.
Our Target is $50, and our SP is $30. The stock is way below our Sell Price. Perhaps it is time for you to get out, especially with the government cutback going on in Washington. We will hang in here for a few weeks and watch events unfold.

VanEck Semiconductor ETF (SMH: $225, down 1%)
HIGH TECHNOLOGY PORTFOLIO
As the name suggests, the VanEck Semiconductor ETF allocates its assets to the various high-fliers of the burgeoning semiconductor and AI industries. The well-known heavy-hitters in the Fund include Nvidia (NVDA), Taiwan Semiconductor Manufacturing (TSM), Broadcom (AVGO), and ASML Holding (ASML), along with several under-the-radar picks such as Lam Research (LRCX) and KLA (KLAC), among 20 other stocks that it deems crucial for this computing revolution that is upon us.
The Fund hasn’t had a great start to the year, with most of its holdings struggling with high valuations and uncertainties regarding the trade wars. We’ve seen an 8% pullback YTD, and while this pales in comparison to the 120% rally since 2022, investors are perplexed about the future of this Fund and industry, particularly in the near term. We, however, have no such qualms, and neither should you.
Leaving aside all the hue and cry surrounding geopolitics, trade wars, tariffs, technicals, and valuations, what truly matters is the underlying demand for chips and the growing use cases for AI across sectors and businesses, which show no signs of slowing down. We’re trying to say that the secular trends of AI, cloud computing, 5G, and electric vehicles are here to stay and will continue to grow dramatically.
A key feature of the Fund is its concentration across many stocks, but as we’ve discussed in the Newsletter, it’s a double-edged sword. With nearly 40% of its assets allocated to just three stocks, Nvidia, Taiwan Semiconductor, and Broadcom, it captured the phenomenal upside in these stocks during the AI frenzy in 2023 and 2024. But now, as the market has pulled back a little, it is facing the downside, with no diversification to come to its aid.
A recent earthquake in Taiwan caused a pullback in Taiwan Semiconductor, though the company claims it had minimal impact on production. However, the VanEck Semiconductor ETF took a hit, as smaller holdings like Lam Research and Applied Materials—due to their limited allocations and long sales cycles—were unable to offset the losses from larger stocks.
During its recent earnings release, Nvidia CEO Jensen Huang claimed that advanced reasoning AI models require 100 times more computing power than the current models. This matters to us, as it means that we’ve barely scratched the surface so far. The VanEck Semiconductor ETF is one of the best vehicles to ride this trend, with a robust track record and a low expense ratio of just 0.35%.
Our Target is $300, and our Sell Price is $230; as you can see, the stock is below this. We added the stock at $270 last summer, so we are undoubtedly underwater. Should we sell and move on, or hold and hope? Good question. No one knows if the overall market will move higher from here, but if it moves lower, we can be sure that the Fund will fall even more. We’re going to stick with it for the next few weeks.

Zscaler (ZS: $205, up 4%)
HIGH TECHNOLOGY PORTFOLIO
Cloud security giant Zscaler released its second-quarter results two weeks ago, reporting $650 million in revenue, up 23% YoY, compared to $520 million a year ago. Profits during the quarter stood at $130 million, or $0.78 per share, against $100 million, or $0.63, beating estimates at the top and bottom lines, coupled with strong guidance for the third quarter and full-year, lifting the stock following the results.
The company’s calculated billings - contractual revenue yet to be realized - stood at $740 million, up 18% YoY, followed by deferred revenue at $1.9 billion, up 25% YoY. Zscaler continues to ride the rising demand for Zero-Trust architecture and security solutions in an increasingly digitalized world. It fulfilled the promise of simplified enterprise security, which has long been the dream of this industry.
Zscaler now sports a customer retention rate of 115%, which is impressive for a SAAS company of this size. It has nearly 3,300 customers with annual contract values over $100,000 and 620 with ACVs greater than $1 million. During the quarter, we saw several new marquee logo adds, including a Fortune 50 energy company, a Global 2000 manufacturing giant, and a nation-state.
The big story is its new Zero Trust Everywhere Initiative, which bundles its security solutions, helping consolidate tools and services while transferring enormous savings to enterprise customers. This gives it a powerful competitive moat, leaving newer entrants and even a few established players at a disadvantage, unable to match Zscaler’s scale and pricing in enterprise security.
The company is making strides by combining Zero Trust with AI, which many companies are scrambling to access, given the risk of data loss when using AI tools such as ChatGPT and Microsoft Copilot. Zscaler checks data streams going to and from tools like ChatGPT, ensuring no leakage in between. This is a critical solution for enterprises looking to fast-track their AI adoption and workflows.
The stock is up 13% YTD and shows no signs of slowing as the company outperforms and outwits peers. Over the years, it has built remarkable moats that the industry is just starting to notice. With the amount of data it tracks and trains its models on, no new entrant can offer similar solutions at scale. It ended the quarter with $2.9 billion in cash, $1.2 billion in debt, and $900 million in cash flow. Our Target is $280, and the SP is $170. We added the stock at $85 in 2019, so we’d like to see it return to its peak in 2021 at $375.

Dexcom (DXCM: $74, up 4%)
HEALTHCARE PORTFOLIO
Medical devices company Dexcom released its fourth quarter results recently, reporting $1.1 billion in revenue, up 8% YoY, compared to $1.0 billion a year ago. It posted a profit of $180 million, or $0.45 per share, down from $200 million, or $0.50 the prior year. For the full year, the company reported $4.0 billion in revenue, up 11% YoY, with a profit of $670 million, or $1.64, against $620 million, or $1.52.
The decline in profits during the quarter was primarily due to a one-time charge of $21 million due to certain mistakes by Dexcom’s shipping partner. Besides this, the company’s new build configurations took a toll on its production yield and gross margins, which stood at 59%, down from 64% a year ago. Management is taking all necessary steps to get production and margins back on track.
Dexcom’s global user base now stands at an impressive 2.8 million, up 25% YoY, with its newly launched over-the-counter solution, Stelo, already adding 150,000 users within four months of launch. This comes amid growing concerns about competitive and substitutive headwinds among investors. Starting with the popularity of GLP-1 drugs, followed by the entry of Abbott and Medtronic in this segment.
As we’ve covered before, the entire premise of GLP-1 drugs reducing demand for continuous glucose monitoring (CGM) devices is flawed. Regarding the competition, Dexcom is addressing this head-on by rehauling its sales and distribution strategy. It has dedicated enormous resources to training sales reps while expanding existing relationships with medical equipment distributors, which are key to this business.
In addition, it is vying for deeper penetration in existing markets while executing aggressive expansions overseas. During the quarter, the company got three of the largest pharmacy benefit managers (PBMs) to cover its products and is now working to onboard other PBMs. It gained similar coverage in New Zealand and France and is set for more wins across Canada, Germany, and others.
In 2025, the company projects $4.6 billion in revenue and 14% YoY growth. The stock didn’t have a great year last year and is down 50% from its all-time high in 2021, but we expect things to turn around soon. The company has barely scratched the surface of the multi-billion-dollar diabetes industry and ended the quarter with $2.6 billion in cash, $2.6 billion in debt, and $1.0 billion in cash flow.
Our Target is $90, and our SP is $70. We have faith in this company and believe that, given a few more months, it will come out on top in its quest to be the best in its class in this great business of continuous glucose monitoring (CGM) technology. Dexcom has built a reputation for accuracy, ease of use, and innovation, making it the gold standard in CGM technology. With expanding adoption beyond Type 1 diabetes and strong financial growth, Dexcom remains the leading player in the space.

iShares Oil & Gas Exploration & Production ETF (IEO: $93, up 2%)
ENERGY PORTFOLIO
As the name suggests, the iShares Oil and Gas ETF is a fund that provides exposure to the high-fliers of the energy industry. However, note that the fund steers clear of the industry's diversified, vertically integrated giants, such as ExxonMobil and Chevron. It allocates most of its assets to pure-play oil and gas producers, allowing it to track commodity prices more closely.
The fund holds a basket of 51 different securities in the energy space, with its top three holdings, ConocoPhillips, EOG Resources, and Phillips 66, constituting 35% of total assets. So far, this year looks to be a mixed mag for the industry, with supply tightening in key regions of the world such as Iran and Venezuela, but things looking up in the US with a new fossil-friendly White House administration.
However, several geopolitical factors are at play, the most prominent of which are tariffs and trade wars by the US government. Most recently, India agreed to buy more oil and gas from the US instead of Russia, Iraq, and Saudi Arabia. This has sent ripples across the industry and bodes well for the US domestic players and, by extension, the IEO fund.
The US government will likely try to reach a similar deal with Europe. With Russian supply still under sanctions, the path is clear for American companies to dominate the global energy industry. US LNG supplies to Europe have already risen over 3,700% since 2017 and will go higher with Russian gas transit through Ukraine now blocked and Europe looking to wean itself off Russian energy entirely.
Asian markets have been out of reach, mainly due to the distances involved and partly the high fees levied by the Panama Canal. The Trump administration is now dealing with the latter, which would be a win for US oil and gas giants. Of course, in the long run, how the industry fares depends a lot on whether the US keeps sanctions on Russia.
The iShares Oil and Gas ETF didn’t have a great year in 2024 and is flat YTD, but things are looking up for its constituents, at least in the mid-term. There are several reasons to love this fund, with a few prominent ones being its low expense ratio of just 0.40%, annualized yield of 2.5%, and an illustrious track record going back nearly two decades. Over the past five years, the fund has returned 320%.
Our Target is $120, and our Sell Price is $95.

Range Resources (RRC: $40, up 4%)
ENERGY PORTFOLIO
This company is one of the largest natural gas producers in the world and released its fourth quarter results recently, reporting $630 million in revenue, down 34% YoY, compared to $940 million a year ago. It posted a profit of $160 million, or $0.68 per share, against $150 million, or $0.63, performing admirably despite bottom-tier gas prices, with results hinting at strong cost controls and execution excellence.
For the full year, the company reported $2.4 billion in sales, down 28% YoY, compared to $3.4 billion a year ago, with a profit of $560 million, or $2.30, down marginally from $570 million, or $2.40. Production averaged 2.18 billion cubic feet equivalent of natural gas per day, coming in ahead of estimates, with 68% being natural gas and the rest comprising natural gas liquids and crude oil.
The company took a hit at the top and bottom lines during the quarter, owing to comparatively lower realized prices. Natural gas realizations stood at $2.36 per million cubic feet equivalent, down from $2.40 last year. Natural gas liquids, however, saw an uptick to $26.43, compared to $24.91, while its negligible crude oil output saw a decline in realizations at $59 per barrel, down from $68 last year.
However, realizations were well ahead of Henry Hub averages, owing to the company’s efforts in marketing and exposure to better-priced markets in the Midwestern and Gulf regions. Even as domestic prices remain under pressure, Range has executed well enough to benefit from prevailing dock constraints and global demand tightness, which we expect to persist.
Range Resources is known for its operational efficiencies that allow it to keep its head comfortably above water even during harsh conditions. Throughout the year, it ran a 2-rig, 1-frac crew operation, which means only two rigs were operational at any given time, with one completion crew digging 800,000 lateral feet across 59 wells, with an average of 14,000 lateral feet per well, thus maximizing efficiencies.
The company is also renowned for its capital allocation. During the quarter, it used its $450 million cash flow to pare down its debt by $170 million while returning $140 million to investors through buybacks and dividends. All-in capital expenditures for the year stood at $650 million, and its balance sheet continues to grow more robust, with $300 million in cash and just $1.8 billion in debt.
The stock has been a solid investment for us - we added it at $28 in 2022. It would be nice to see it at $90 like it was in 2014. Our Target is $41, and our Sell Price is $27, which are moving today to $50 and $33, respectively. It’s a relatively small firm, clocking in at just under $10 billion in market cap, and it is certainly a buyout candidate. With higher crude prices later this year or early next, we can see this stock back up to the $50+ level.

Ally Financial (ALLY: $36, up 7%)
FINANCIAL PORTFOLIO
Banking and auto finance giant Ally Financial released its fourth quarter results recently, reporting $2.1 billion in revenue, up 5% YoY, compared to $2.0 billion a year ago. It posted a profit of $250 million, or $0.78 per share, against $120 million, or $0.40 the prior year. Despite bearing the brunt of a $560 million credit provisioning against bad loans, this also hints at a phenomenal year ahead.
The company originated $10.3 billion of auto loans during the quarter, up 7% YoY, with a weighted average yield of 9.6% and 49% of originations in the higher credit quality tiers. This is down a bit from their yearly average of 10.4% in response to falling interest rates. Still, the company’s net interest rate margins hold steady at 3.3%, leaving plenty of cushion to deal with uncertainties.
Ally’s insurance business continues to grow, with $370 million in written premiums during the quarter, up from $330 million a year ago. Retail deposits stood at $143 billion, up from $142 billion across 3.3 million customers, and an average retention rate of 95%. During the fourth quarter alone, the company saw retail deposit growth of over $2.0 billion. The company is a top-tier banking services provider.
The big story during the quarter concerns the sale of its credit card business, which, despite being a good business, allows Ally to focus all of its efforts and resources on its core offerings, banking and auto financing. It called to cease mortgage originations, which only offer 3% yields, so this move is expected to free up capital for other high-yielding loans and investment opportunities.
Ally has been restructuring its operations, which involve extensive workforce reductions, resulting in savings worth over $60 million annually. The sale of its credit card business is expected to dampen net interest margins in the medium term, as the segment yields over 20% annually. Still, it will minimize future credit costs and operating expenses, and this restructuring should help offset the loss of revenue.
The stock was flat last year and continues to be range-bound so far this year, but things are turning around for the company as all of its restructuring efforts start to pay off. The company did not buy back any stock during the year, but its dividend yield has increased to 3.3%. It ended the quarter with $10.3 billion in cash, $18.3 billion in debt, and $4.5 billion in cash flow.
Our Target is $52, and our Sell Price is $35.

Welltower (WELL: $147, down 1%)
HEALTHCARE PORTFOLIO
Leading healthcare REIT Welltower released its fourth quarter results recently, reporting $2.3 billion in revenue, up 29% YoY, compared to $1.7 billion a year ago. It posted a profit, or FFO, of $720 million, or $1.13 per share, against $530 million, or $0.96. For the year, the company reported $8.0 billion in sales, up 20% YoY, with a profit of $2.6 billion, or $4.32 per share, against $1.9 billion, or $3.64.
Welltower had a strong quarter on the operations front, with same-store operating income growing 24% YoY, marking its ninth consecutive quarter of 20-plus percentage gains. The occupancy rate stood at 87%, rising by an impressive 310 bps YoY and 120 bps sequentially, which management noted was during the time of year when move-ins often moderate, hinting at a growing broad-based momentum.
The company has over 750 healthcare facilities in the U.S., Canada, and the U.K.
During the quarter, Welltower deployed $2.4 billion across 21 different transactions, with $2.2 billion in acquisitions and loan funding and $230 million in development funding. This is a 20% decline YoY from $3.0 billion a year ago, but it marks an end to a tremendous year of investment activity, with YTD acquisitions totaling $7.0 billion, up 19% YoY, compared to $5.9 billion during the same period last year.
The company is also off to a great start this year, with $2 billion in gross commitments under contract within the first six weeks. Management attributes this to favorable market dynamics, with the over-80 population rising quickly and limited new supply owing to high interest rates and rising material costs, coupled with a new immigration policy making it harder for competitors.
Welltower is pursuing a renewed approach to capital allocation, focusing on ‘Local Clustering,’ which involves ‘going deep, not broad.’ Thus, the company will allocate more capital in each region, aiming for more properties and density instead of diversifying across many areas. This allows for plenty of cost synergies, which can be beneficial as the new RIDEA structure gains steam.
The RIDEA structure allows Welltower to participate in the operating profits of its facilities, as opposed to merely earning rent. This can be a game-changer for the entire industry, particularly senior housing. The stock is off to a great start, rallying 17% YTD, and the firm maintains a robust balance sheet as it enters a lucrative period, with $3.5 billion in cash, $16.8 billion in debt, and $2.3 billion in cash flow.
Our Target is $155, and our Sell Price is $115. It hit $157 a few weeks ago and has pulled back an inch. We’re raising our SP to $130 and can’t wait to raise the Target to $180 in another few weeks as it passes $150.

-----------------------------------------------------------------------------
The Bull Market Report High Yield Investor
Fed meetings has gotten shorter and sweeter lately: no change in interest rates, thus minimal reaction from the market. Once again, Powell and company hit "pause" while they wait to see what trade policy does to consumer prices. If inflation edges up a bit, that pause will lengthen or force the Fed to tighten again in response.
But if the economy takes a sharp enough downturn to shake the job market, you can bet that the rate cuts will start up again fast and furiously. That's never been far from Powell's mind or commentary in recent years. He's willing to tolerate a mild recession in order to kill inflation but anything that aspires to the catastrophic levels of 2008 or 2020 will trigger massive retaliation.
As it is, the now-notorious "dot plot" that telegraphs the Fed's sense of its next moves remains clear. Three months ago, Powell and company thought the economy would expand at a healthy 2.1% rate this year. Now that GDP growth number has come down to 1.7%, which is not "better" but still a long way from the apocalypse. The Fed doesn't really think that growth will get much lower or much higher than this in the long run, so this is roughly as good AND as bad as it gets. This is normal.
Likewise, the Fed doesn't see unemployment rising or falling much from here. Again, in their view this is normal. Remember, they get all the macro data the government produces. When they make a forecast, it's usually pretty good. And they see inflation going down on its own, which gives them leverage to make as many as two rate cuts this year and then another two next year. Not a quick race back to the zero-rate world, but guess what? That world, created in the long shadow of the 2008 crash, was never normal. From here, rates may edge up and down but barring an extreme economic surprise, this is the world we live in now.
In this world, cash is unlikely to pay more than 4% and even long-term Treasury yields may have peaked. To earn a higher rate of return, you need to reach beyond the federal bond market into areas that have been neglected or even actively shunned. Muni bonds, for example, have been under serious pressure as some regions of the country teeter closer to recession and maybe even default, but that's an opportunity if you know how to pick the people who can pick the best bets in the field. Here's one of our favorites:
Invesco Municipal Trust (VKQ: $9.73, down 1%. Yield=7.3%, the equivalent of 10.3% taxable)
HIGH YIELD PORTFOLIO
The Invesco Municipal Trust is a closed-end fund that primarily invests in tax-free municipal bonds, making it very appealing to conservative, income-seeking investors. The fund still goes the extra mile in the relatively risk-free muni space. Further, it diversifies its holdings while actively managing and rebalancing them to drive additional value for investors, making it perfect for risk-averse investors.
Muni bonds had a modest year in 2024, with total returns of just 1.05%. It was an election year with major consequences for the debt markets and started with relatively high interest rates. We saw a jump in late 2024, right after the election, in anticipation of pro-growth policies by the incoming administration, with high-yielding munis ending the year with over 6% in gains.
In 2025, the year has been a mixed bag for the segment, starting with yields dipping in January in response to cooler inflation readings. However, this was followed by rising yields in February and March, with new issuances pressuring muni prices. Right now, yields are at their highest in over 2 years, with the Fed’s ‘higher-for-longer’ policy bias keeping volatility in the segment elevated.
Last year, we saw record new issuances worth over $500 billion, which marks a YoY increase of 36%, and most analysts expect the market to surpass these figures in 2025. The good thing is that there is plenty of demand for muni bonds to soak up these new issues, with the asset class now being deemed the most attractive among its fixed-income peers when weighing it on an absolute yield basis after tax.
With plenty of uncertainties surrounding global equity markets and the potential implications of a trade war and other geopolitical tensions, munis are a much-needed safe haven that will see billions of dollars in new inflows over the next few months. As long as their tax-exempt status remains, we expect the asset class to continue going strong with plenty of new issuances and inflows.
One of the reasons for the uptick in activity is the ongoing talks of altering the tax-exempt status of munis in Washington. This has led to the front-loading of issuances before any such policy changes. However, we firmly believe that any such changes will be fairly limited, such as capping the deductions for wealthy investors. None of this should matter for long-term investors, especially with a fund such as the Invesco Municipal Trust, given its illustrious track record for several decades.
Our Target is $13, and our Sell Price is $9.

Good Investing,
Todd Shaver, Founder and CEO
The Bull Market Report
Since 1998

by Scott Martin | Jun 2, 2024 | Weekly Newsletter 7pm Sunday
Market Summary
The Bull Market Report
The last two weeks were a tale of one stock. We spent a few days waiting for NVIDIA (NVDA) to release its quarterly results, leaving Wall Street almost literally breathless in the meantime. Then we watched money crowd into NVIDIA after the SEC filing, swelling the stock to lofty levels ($2.7 trillion, more than the entire German market). And finally, investors tired of scrutinizing this AI giant found a distraction in the form of a potentially threatening uptick in bond yields. We're happy we have NVIDIA in our High Technology portfolio. It's already soared close to 140% in the last six months for us.
But we'll never be satisfied with exposure to just one stock, no matter how strong it is in the moment. If that were the case, we'd have cut everything but Apple (AAPL) or Berkshire Hathaway (BRK-B) long ago, and had to live with the day-to-day consequences of that decision. In our world, a balanced portfolio of themes will win in the end. When Technology is triumphant, we have plenty of those stocks scattered around our universe. When Silicon Valley hits a wall, our Financials or Energy or Real Estate holdings tend to benefit as the pendulum of sentiment swings in their favor. And throughout the cycle, our High Yield recommendations keep paying dividends.
How has that paid out for us in the last two weeks? NVIDIA obviously did extremely well on its own, but its success sucked all the air out of the Technology portfolio and cut big holes into our results in the Stocks For Success and Long-Term Growth portfolios as well. Only mighty Apple managed to rise above the tide on the Stocks For Success side. First Solar (FSLR) was an absolute triumph and helped buoy Long-Term Growth. See below.
What's more interesting is the way the Early Stage recommendations were split between a 12% gain in the past two weeks for C3.ai (AI) and a 12% loss from Recursion Pharmaceuticals (RXRX), leaving the portfolio neutral for the period. A lot of our portfolios sat out the NVIDIA cycle close to neutral. This was a non-event as far as they were concerned. Now that Wall Street's attention has moved on, we expect them to recover their momentum and get back to work.
For now, this was a "rebuilding" period for our stocks. The Dow Industrials lost more ground but the Nasdaq, overweight NVIDIA as it is, held up better than the BMR universe in the aggregate. That's okay. Ordinarily our "equal weight" system for accounting for our performance plays out in our favor. This time, the single standout name was so strong (and nearly everything else was so tentative) that only portfolios that were heavily concentrated in NVIDIA managed to do well. One way or another, earnings season is over. It was a good one. We can afford to let the AI giant hog the spotlight. After all, we own it too.
In our view, bond yields are a sideshow. They sting, but the real story is what the Fed said two weeks ago. It's going to take serious pain in the Treasury market to feed back into our stocks. And get serious: that kind of pain in the Treasury market is not going to entice smart investors to pull their money out of stocks and flood into the "safety" of bonds paying less than 5% a year. That kind of pain is not enticing. It's scary. And it feeds on itself. Stocks like ours may even look defensive in that scenario. But in our view, the scenario is unlikely. The bond market corrects itself. When yields are attractive to the people who want bonds, you'll know. Otherwise, we focus on stocks.
There's always a bull market here at The Bull Market Report. With earnings season on the books, The Big Picture tackles the question of whether stocks have gotten ahead of their growth rates, while The Bull Market High Yield Investor sets the scene for the next Fed meeting And as always, we can't resist updating you on our latest thoughts on our favorite recommendations.
Key Market Indicators
-----------------------------------------------------------------------------
The Big Picture: Record Earnings, Record Stocks
Despite the persistent drag from the Fed on the short end of the yield curve and a weakening bond market on the long end, the economy remains resilient and the largest corporations in the world are making more money than ever. With 98% of S&P 500 companies reporting results, the index is on track for a healthy 6% growth in earnings per share. This surpasses analysts’ earlier forecasts of 3.2% growth, marking the biggest year-over-year increase since mid-2022 and quite the upside surprise. So far, nothing in the recent past has provided even a speed bump, and guidance suggests that things get even stronger in the current quarter and beyond.
When earnings hit records, stocks deserve to hit records too. That part is inevitable. The only question is how far investors' comfort zone will stretch to accommodate stronger fundamentals when valuations across the market are already on the high side of recent memory. After doing the math, we aren't especially worried that stocks have gotten ahead of their growth trend.
Think about it. Yes, the S&P 500 is currently priced at 20.3X forward earnings, which is significantly elevated when you consider that across the past decade the market only commanded a 17.8X multiple. However, it's barely a notch above where it's averaged out over the last five extreme bear-and-bull-and-bear-and-bull years. And because growth shows every sign of accelerating in the coming year, we wouldn't be shocked next summer to see the market as a whole at least 15% above where it is now. That's better than what stocks have historically delivered over the long haul. It's a boom.
And even in this 15% scenario, there's a strong argument that stocks will be strategically attractive at that point. The Fed will find an excuse to guide the short end of the yield curve down. That's a good thing for the market, giving valuations an excuse to reinflate as the "risk-free" return rate on cash drops. Long-term yields should drop far enough with it to take a lot of pressure off the economy and Wall Street alike.
Meanwhile, earnings expansion is on track to speed up from 11% for this year to 14% in 2025.
Those extra 3 percentage points bend the P/E calculations just enough to eliminate just about any rational fear that stocks are overvalued now. Remember, smart investors pay extra for faster growth because every additional percentage point on that side shortens the amount of time you need to wait in uncertainty and doubt to see your companies grow into what would otherwise look like high valuations. We wouldn't be shocked to recheck the numbers in 12 months and see the S&P 500 in the aggregate bringing in as much as $50 more per "share" (spread across all 500 stocks of course) than it's making now, and then at the end of 2025, adding another $35-$40 to that pool of cash takes the S&P 500 multiple down BELOW long-term historical averages if the market doesn't move appreciably in either direction in the meantime.
All you need to take advantage of that discounted future is buy stocks today and hold on until next summer. There will undoubtedly be volatility. Maybe it will take the market down, in which case the discount will be even more substantial a year from now. And maybe it will take the market up, in which case the route to positive returns pays off earlier. All in all, analysts collectively think the market can rally another 13% or so in the next 12 months. At that point, if all the projections line up with reality, the market looks LESS overheated on an earnings basis, even though investors would have reason to cheer with a better-than-average annual gain on the books.
We like the odds of executives continuing to outperform. They've already successfully weathered an earnings recession, a slowing global economy and just about everything inflation and interest rates can throw at them. Give them a little relief and the numbers will go through the roof. All we need to provide is that year of fortitude. It feels like a pretty good bet.
-----------------------------------------------------------------------------
BMR Companies and Commentary
C3.ai (AI: $30, up 23% last week)
Early Stage Portfolio
Enterprise AI company C3.ai released its fourth-quarter results last week, reporting $87 million in revenue, up 20% YoY, compared to $72 million a year ago. The company posted a loss of $14 million, or $0.11 per share, against $15 million, or $0.13, with a beat on estimates on the top and bottom lines, coupled with robust guidance for the new year bringing much-needed glad tidings for investors.
For the full year, the company posted $310 million in revenue, up 16% YoY, compared to $270 million a year ago, with a loss of $56 million, or $0.47, against $46 million, or $0.42. With demand for enterprise AI solutions continuing to intensify across industries, the company exceeded the top end of its guidance for the full year as well. It marked its fifth consecutive quarter of accelerating revenue growth.
During the quarter, the company signed 47 new agreements, including 32 new pilots, with marquee clients such as ExxonMobil, General Mills, BASF Petronas, and the US Navy, among others. This has resulted in subscription revenues rising 41% YoY, constituting 92% of its total revenue, giving the company much-needed stability and certainty regarding its cash flow position going forward.
C3’s focus on expanding its partner network has paid off well, with 91 of the 115 agreements closed last year from companies such as AWS, Google Cloud, and Microsoft Azure. The qualified opportunity pipeline with the partner network grew a huge 63% YoY. The company received a blockbuster response for its GenAI offerings, with 50,000 inquiries coming from 3,000 businesses during the fourth quarter; alone.
Some thoughts:
C3.ai's future holds promise, but it's definitely on the speculative side of the AI industry. Here's a breakdown of their potential and competition where it fits into the landscape of the AI revolution:
Strengths:
- Focus on Enterprise Applications: Unlike some AI companies targeting broad consumer markets, C3.ai focuses on developing enterprise-grade AI solutions for specific industries like manufacturing, energy, and healthcare. This targeted approach allows them to cater to specific needs and potentially achieve faster adoption.
- C3 AI Suite: Their core product, the C3 AI Suite, offers a comprehensive platform for developing, deploying, and managing AI applications. This can be attractive to businesses looking for an all-in-one solution.
- Partnerships: C3.ai has established partnerships with major technology players like Microsoft and Google. This gives them a leg up in terms of access to resources and market reach.
Challenges and Competition:
- Emerging Market: The enterprise AI market is still evolving, and it's not guaranteed that its approach will be the most successful in the long run. They face competition from established tech giants like Microsoft, Amazon (AWS), and IBM, all with significant resources and cloud computing expertise.
Profitability: C3.ai is not yet profitable, and it's unclear how quickly they can achieve profitability in this competitive landscape
The best choice for you depends on your risk tolerance and specific investment goals. The company offers a potentially high reward but also carries a higher risk due to the competitive landscape and its unproven track record of profitability.
The stock has had a fairly volatile year so far, but the recent rally following its fourth-quarter results has put it firmly in the green. As of now, the company is focused on growth, giving profitability a pass, but a pole position in the potentially $1 trillion enterprise AI market will ultimately will make it worthwhile. The company has sound financials, with $750 million in cash, and no debt. Our Target for this very speculative high-flyer is $50 with the Sell Price at $24. We added the stock at $22 in 2023, so we are up 34%. But is it worth the anguish or the volatility? Only YOU can decide that!

-----------------------------------------------------------------------------
The Trade Desk (TTD: $93, down 2%)
High Technology Portfolio
Pioneering ad tech company The Trade Desk released its first quarter results recently, reporting $490 million in revenue, up 28% YoY, compared to $380 million a year ago. It produced a profit of $130 million, or $0.26 per share, compared to $110 million, or $0.23, with a beat on consensus estimates on the top and bottom lines, coupled with an upbeat forecast for the second quarter. We are impressed by the profitability level – 27% after tax. That’s up there with some of the greatest companies in the market, like Apple, Google and Facebook.
During the quarter, the company was aided by continued penetration of connected TVs, with industry giants such as Disney, NBC Universal, and Roku making deeper pivots into this segment. This comes as the company’s UID2*, its alternative to the aging browser cookies, as it becomes more and more ubiquitous across the open internet, resulting in robust value for advertisers, and undeniably strong moats for Trade Desk. Unified ID 2.0 (UID2) is a non-proprietary, open standard accessible to constituents across the advertising ecosystem. It enables advertisers, agencies, ad technology companies, and ad publishers selling advertising to interoperate together in advertising workflows. The company struck a string of new collaborations and partnerships with its UID2 during the quarter, starting with Times Internet, a leading media conglomerate in India, followed by satellite TV giant, Dish Media, along with TF1 and M6, two of the largest broadcasters in France. As a result, the platform now has access to ad inventory in over 11,000 destinations across connected TV, display, mobile, and audio.
The Trade Desk isn't just another ad network; it provides a self-service, cloud-based platform for ad buyers. This platform allows businesses and agencies to plan, manage, and optimize their advertising campaigns across various channels and devices. Here's what makes them special:
- Independent and Open Platform: Unlike some ad networks that prioritize their own inventory, The Trade Desk offers an independent platform with access to a vast marketplace of ad inventory. This gives ad buyers more control and flexibility in reaching their target audience.
- Data-Driven Targeting: The Trade Desk leverages data and analytics to help ad buyers target specific audiences with greater precision. This can lead to more effective and efficient advertising campaigns.
- Programmatic Bidding: They automate the ad buying process, allowing advertisers to bid on ad impressions in real-time based on pre-defined criteria. This can help them secure better ad placements at more competitive prices.
Why They Are Leaders:
- Focus on Innovation: The Trade Desk is constantly innovating and developing new features to stay ahead of the curve in the fast-evolving advertising landscape.
- Transparency & Control: They prioritize transparency and control for advertisers. This builds trust and encourages long-term partnerships.
- Global Reach: The Trade Desk operates in a global marketplace, giving advertisers access to a vast audience.
The Trade Desk has strong secular tailwinds in its favor within the digital advertising market, which stood at $600 billion in 2023, expected to rise to over $870 billion by 2027. Global streaming giants are doubling down on advertising: Netflix with its 40 million ad-tier subscribers and Disney+ have already announced partnerships with the company to monetize their massive ad inventory.
The stock had a phenomenal year in 2023, up 60%, which has been extended this year with a YTD rally of 31%. While the valuation is anything but cheap, at 22 times sales and 120 times earnings, the massive addressable market and an impressive compound annual growth rate of 32% largely make up for it. The company ended the quarter with $1.4 billion in cash, just $240 million in debt, and $600 million in cash flow. Our Target is $100 and our Sell Price is $64. We’re raising both to $120 and $84 respectively. The stock hit $97 two weeks ago, not quite a new all-time high, as that was set in 2021 at $114. But we can see that number being broken later this year if the market holds steady and moves higher. If not, that is why we have such a tight stop. No matter how good a company is, if the overall market tanks hard, it will bring these high flyers down with it. Revenues are great – moving from $840 million in 2020 to $1.2 billion, to $1.6 billion to $1.95 billion in 2023. What worries us the most, is its low level of profitability. Watch this one closely.

-----------------------------------------------------------------------------
Workday (WDAY: $211, up 4%)
TERMINATING COVERAGE
Workday, a leading financial and human capital management solutions provider, released its first quarter results last week, reporting $2.0 billion in revenue, up 18% YoY, compared to $1.7 billion a year ago. It posted a profit of $103 million, or $0.38 per share, against -$10 million, or $0. The company beat on consensus estimates but lowered full-year guidance a bit. See below.
As always, subscription revenues led the way at $1.8 billion, up 19% YoY, with the rest coming from professional services at $180 million, up 12% YoY. The company’s 12-month subscription backlog now stands at $6.6 billion, up 18% YoY, followed by total subscription backlog at $21 billion, an increase of 24% YoY. The gross revenue retention rate came in at 95%, representing a churn of just 5% over the year.
During the quarter, the company onboarded several marquee new companies. This includes Asda, Electrolux, TopGolf, and LVHM, among others. In the public sector, the company acquired the Defense Intelligence Agency (DIA) as a customer for its Workday Government Cloud. It now counts 60% of the global Fortune 500 as customers and was named a leader in cloud Human Capital Management for 1,000+ employees by Gartner.
The company continues to double down on AI and now has 50 AI and 25 generative AI use cases in its roadmap. Workday completed the acquisition of HiredScore, an AI-powered talent acquisition and internal mobility solution. With 65 million users and 800 billion transactions on its platform each year, the company has a wealth of data to train its AI and leapfrog competitors.
Following a robust performance last year, the stock has had a rough start to 2024, and is down 21% YTD, mostly owing to its high valuation. We believe that this is unjustifiable, and overblown, considering the massive addressable market of $140 billion, and an impressive 5-year CAGR of 20%. Workday ended the quarter with $7.2 billion in cash, $3.3 billion in debt, and $2.2 billion in cash flow. Our Target is $325 and our Sell Price is $250.
We, that is, you and we have a decision to make. Do we let the company go here? Or do we buckle down and add more? We added the stock at $139 in 2018, so we are up over 50%. You, however, may have a higher entry price. Not that that makes any difference. It just feels better if you can sell and take a profit, even though the stock was at $311 in February. Revenues have been growing for the past four years, from $4.3 billion in 2020, to $5.1 billion, to $6.2 billion, to $7.3 billion in 2023. At the current rate it looks like $8.0 billion is probable for 2024. Growth appears to be slowing and we wonder: Is this 10% growth rate worth such a high valuation? The market just might have something here.
Here’s what occurred: When Workday reported quarterly earnings a week ago, it lowered its forecast for fiscal 2025 subscription revenue to between $7.7 billion to $7.725 billion from a prior call for $7.725 billion to $7.775 billion. That prompted a flurry of price-target cuts from Wall Street. This is a tiny lowering. It is such a small reduction, that you have to re-read the sentence to understand the difference. The stock was smashed. This is what the market is doing to great companies. We’re not happy about it, but it is reality. For this reason, and the slowdown in growth discussed in the previous paragraph, we are going to exit the stock. Tough decision, but the market is just destroying growth companies with slower growth in the forecast.
If you wish to stay in the stock, the knockdown of the stock by $52 a share (19%) since earnings a week ago, certainly creates a better valuation now. It’s down $100 (32%) since February. With cash of $7.2 billion and debt of $3.3 billion, the balance sheet is strong.
-----------------------------------------------------------------------------
First Solar (FSLR: $272, up 2%)
Long-Term Growth Portfolio
First Solar released its first quarter results recently, reporting $800 million in revenue, up 45% YoY, compared to $550 million a year ago. It posted a profit of $240 million, or $2.20 per share, against $42 million, or $0.40, with a beat on consensus estimates on the top and bottom lines, all driven by macro regulatory tailwinds, ever since the passing of the IRA Act in 2022.
The company has a sales backlog of 78.3 GW, up from 71.6 GW a year ago, with net YTD bookings at 2.7 GW, down from 12.1 GW. Its average selling price stands at 31.3 cents per watt, down from 31.8 cents a year ago. The company expects its bookings backlog to extend through 2030, as there is seemingly no stopping demand for rooftop solar and large-scale solar energy generation projects.
While much of the solar energy industry reels from the structural overcapacity in China, First Solar has circumvented this threat, with its focus on differentiation and its business model. The company’s cadmium telluride semiconductor technology is vastly better than the commoditized crystalline silicon modules coming from China, which are known to harbor various reliability and quality issues.
Beyond the regulatory tailwinds, the company stands to benefit from the rise of generative AI as tech giants look to transition towards green energy to operate their massive new data centers, with First Solar being the preferred choice. A typical query on ChatGPT consumes 50 times more energy than a Google Search, so the giants of AI must make this shift to solar if they want to save money and don’t want to come under criticism.
It is already up 58% YTD and is showing no signs of slowing with plenty of tailwinds in its favor, and a pole position in the market. First Solar ended the quarter with a robust balance sheet, with $2 billion in cash reserves, just $680 million in debt, and $900 million in cash flow.
Many leading analysts from UBS, Piper Sandler, and JP Morgan Chase have increased their Price Targets for the stock. UBS raised its target to $320, from $270, the highest on the Street. Our Target was destroyed in the last two weeks as the stock rallied from $187 on May 14th to its present level of $272. We’re up 40% in less than a year. At $215 it is time to raise. We love this company so we are going to best UBS and place a $325 Target on the stock. Our Sell Price of $140 is hereby raised to $240.

-----------------------------------------------------------------------------
iShares US Oil & Gas Exploration & Production ETF (IEO: $103, up 2%)
Energy Portfolio
A pure-play energy fund with concentrated exposure to oil and gas companies that are exclusively involved in exploration and production, this fund closely tracks global energy companies and is thus subject to the industry’s swings and volatility. So far this year, the fund is off to a flying start and is up 9% YTD, mainly owing to the recovery in natural gas prices following a prolonged slump over the past year.
Given a short to medium-term horizon, the oil and gas industry is always eventful, with plenty of geopolitics and macroeconomic factors coming into play. For example, right now there is the Red Sea crisis, a prolonged conflict in the Middle East, and Ukraine intensifying its attacks on Russian oil refineries, among a host of other things to factor in, that could lead to swings in global energy prices.
On the macro front, the demand from China is still weak, but a recovery is in the cards, which could push oil prices beyond the $85 mark. Apart from that, a rate cut by the Fed sometime later this year, and a recovery in demand from Europe this winter for space heating and other residential and commercial uses can all lead to a much-needed rally in natural gas prices, which remain at multi-year lows.
When taking a long-term view, there is a lot to be optimistic about oil and gas stocks. This might seem counterintuitive considering the growing environmental movements the world over, alongside new alternative energy sources, but we believe that natural gas and hydrogen will play an outsized role in this transition. This too will take anywhere from two to three decades to become a reality, and in the meantime, oil and gas giants will be reaping profits.
The Exchange Traded Fund allows investors to ride this trend with its highly concentrated portfolio, with 45% of its assets held in ConocoPhillips, EOG Resources, Marathon Petroleum, and Phillips 66. These are all companies with massive inventories and low production costs, helping generate outsized returns during bullish streaks in energy prices, while still outperforming when prices slump.
Our Target is $120 and our Sell Price is $95. This fund is a great way to own an assortment of energy companies in one transaction. We added the fund at $80 two years ago.

-----------------------------------------------------------------------------
Recursion Pharmaceuticals (RXRX: $8.28, down 10%)
Early Stage Portfolio
Recursion Pharmaceuticals, a leading AI and machine learning company in the biotech space, released its first quarter results a month ago, reporting $13.8 million in revenue, up 14% YoY, compared to $12.1 million a year ago. It posted a loss of $91 million, or $0.39 per share, as against a loss of $65 million, or $0.34 the prior year, but posted a beat on consensus estimates on the top and bottom lines.
Rising losses were largely the result of increasing R&D expenses, at $68 million, up from $47 million a year ago. This was followed by a similar rise in administrative expenses at $31 million, up from $23 million, as the company has been on a hiring spree. Revenues during the quarter were entirely from its partnership with Swiss life sciences company, Roche, which the company expects to scale further.
Recursion has plenty of value catalysts coming up over the next few quarters, which can be quite profitable for the company in a significant way. This includes five drugs in phase 2 clinical trials, each with over 100,000 potential patients worldwide, and no competitor. If the company can successfully commercialize just one of these five drugs, it can add significant value from current levels.
Its AI-enabled drug discovery platform continues to gain momentum, with potential new partnerships and the exercising of existing partnership options capable of driving top-line growth. The company’s 20 petabytes of data collected from real patients, when used with its internal AI software is a game changer for the industry, prompting Roche and Bayer to start working with Recursion.
The company’s AI play has been formidable enough to warrant a $50 million investment from Nvidia, and it has grand plans in this regard, including a next-generation supercomputer. The stock is down 16% YTD, and it stands to offer enormous value if catalysts start to align going forward from present levels. It has a robust balance sheet, with $300 million in cash, and just $50 million in debt. Our Target is $28 and our Sell Price is $8, which is getting tight. We added the stock at $10 just six months ago and it ran up to $17 in February but has since settled down. This is a speculative stock for sure. Enjoy the ride, but be careful.

-----------------------------------------------------------------------------
ARK Innovation ETF (ARKK: $42, down 4%)
TERMINATING COVERAGE
Cathie Wood's flagship Innovation ETF has had a rough start to the year and is down 16% YTD. This comes as the broader equity markets, including disruptive tech stocks, have posted a rally this year. The pullback can be attributed to its high exposure to Tesla, which has been a key detractor for the fund in recent quarters.
The fund’s overreliance on Tesla is clearly wearing it down, and alongside this, other key weak investments include Roku (down 88% from peak), Unity Software (down 90%), Pacific Biosciences (down 96$), and Teladoc, which is down 50% this year and over 95% from its peak in 2021. Ark attributes the weakness in Tesla to auto sales still being lower than pre-COVID levels, but we think the various controversies surrounding Tesla’s founder, Elon Musk, and his controversial $45 billion compensation package could have contributed just as much, not to mention his purchase of Twitter, spending half his time with SpaceX, and many other strange personal quirks that this genius brings to the table. In our opinion, the fund’s underperformance in recent quarters is largely due to it being underweight on market leaders and mega-cap stocks, which have led the rally in 2023 and this year so far.
Investors should start treating the Ark Innovation ETF like a venture capital or private equity fund, which often comes with a lock-in period lasting a few years, up to a decade. That’s how long it takes for disruptive innovations to pay off, and at current levels the stock offers robust value, making it perfect for value-seeking investors with a long enough time horizon.
We are asking ourselves some tough questions lately. Cathie Wood has clearly lost her magic. We added the stock in 2021 at $117, after it had hit an all-time high of $158. We thought it was overvalued and waited patiently for it to come down. Come down it did, but it has continued to erode for the past three years, going nowhere for the past two years, languishing in the low 40s. Why do we continue to hang on to this stock? That’s a good question. We have again been patient with this fund, but for far too long. We don’t have the time to wait any longer. There are much better places for our funds, than the many pie-in-the-sky investments she has made these past few years.
We are exiting the fund and moving on. We’d rather own more Nvidia, more Super Micro Computers, or Eli Lilly and Novo Nordisk.
-----------------------------------------------------------------------------
The Bull Market High Yield Investor
The clock is now ticking on the next Fed policy meeting on June 12. Nobody expects a rate cut or a rate hike at this point. We're more interested in seeing whether consumer inflation numbers due out that morning have any impact on Jay Powell's prepared marks: a soft or "cool" print could once again prompt a lot of talk about relaxing overnight lending rates when the moment is right, while anything hotter than expected could have the opposite effect. Whatever we see this month, it's unlikely to change the primary narrative around the Fed, which is that we'll probably be in a place where Powell and company can start relaxing in September and cut more aggressively after that.
We've been saying it for months and we were right. Short-term interest rates have peaked. People parked in money markets are unlikely to earn more on those accounts than they're making right now. And as the short end of the yield curve recedes, upward pressure on the long end will evaporate along with it. There simply won't be a reason for capital to keep flowing out of Treasury bonds into those money market accounts. And as the bond market stabilizes, long-term yields have less reason to keep climbing to the point where they spook us here in the stock market.
Add it all up and if you're looking for a relatively smooth income stream without the strain of life in the stock market, you need to lock in Treasury yields where they are. That means settling for 4-5% a year, which translates into 2-3% above where the Fed wants to guide inflation in the long term. Maybe a 2-3% real return is enough for you. We have a feeling most investors will want their money to work a little harder, which is why we're banging the drum on stocks and funds like these.
Arbor Realty (ABR: $13.68, up 2%. Yield=12.6%)
REIT Portfolio
Leading Mortgage REIT Arbor Realty released its first quarter results recently, reporting $104 million in revenue, down 5% YoY, compared to $109 million a year ago. It posted a profit or FFO of $58 million, or $0.31 per share, down from $84 million, or $0.46. This was a mixed quarter for the company, with a beat on the top line, but a miss at the bottom, largely owing to a big drop in loan originations across the board due to the tougher mortgage business, due to 7% 30-year loans.
Agency loan originations during the quarter stood at $850 million, down from $1.1 billion a year ago, which Arbor had warned against a couple of months back. The company believes that the first two quarters of this year will include peak stress, as interest rates remain higher, with a possibility of a rate cut in late 2024. Borrowers are deferring taking loans in anticipation of lower rates.
Arbor’s structured portfolio, however, continues to do well, albeit with a small YoY decline, with $256 million in originations, down from $266 million the prior year, with a total of 59 loans being originated, the same as last year. Similarly, the company’s servicing portfolio hit new highs during the quarter, at $31 billion, up 8% YoY, compared to $29 billion a year ago, with a net servicing revenue of $31 million.
The company has done remarkably well throughout the pandemic, and the volatile interest rates environment that followed. This was largely owing to its diversified business model with multiple countercyclical income streams. For instance, if interest rates continue to remain high, originations will take a hit, but the mortgage servicing rights portfolio will increase in value due to low refinancing rates. Who is going to refinance a 3-4% loan at today’s 7% level?
This has helped it maintain its distributable earnings in excess of dividends, and a payout ratio of at least 90% throughout, all the while maintaining its book value, currently at $13.02. Over the past few months, Arbor has held outsized reserves to hedge against delinquencies and has continued to shore up liquidity, resulting in a robust balance sheet, with $910 million in cash, $12 billion in debt, and $550 million in cash flow.

Realty Income Corporation (O: $53, up 2%. Yield=5.9%)
REIT Portfolio
Realty Income, "the Monthly Dividend Company," is one of the largest investors in commercial real estate across the globe and recently reported $1.2 billion in revenue, up 40% YoY, compared to $940 million a year ago. It posted a profit or FFO of $790 million, or $0.94 per share, against $680 million, or $1.03, with a beat on top-line estimates, but a miss at the bottom, making it a mixed performance.
The company is structured as a real estate investment trust, and its monthly dividends are supported by the cash flow from over 13,250 real estate properties owned under long-term lease agreements with commercial clients. During the quarter, the company invested $600 million across a wide range of properties, with a weighted average yield of 7.8%. A significant chunk of these investments, or $320 million was allocated towards assets in the UK and Europe, with an average yield of 8.2%. The company invested $38 million in a US-based data center joint venture, marking its first investment in the space.
Another big milestone during the quarter was the completion of the $9.2 billion acquisition of Spirit Realty Capital, with the new combined firm valued at $63 billion, and Spirit shareholders set to own 13% of it. The CEO of Arbor stated that the transaction is immediately accretive. This gives Realty Income significantly more size, scale, and diversification across asset, geographical, and demographic lines, along with the potential for realizing various cost and operational synergies.
This was an eventful quarter for the company in terms of capital activity, starting with a secondary offering to raise $550 million an at average price of $56.93 per share. Followed by $450 million in 4.750% senior unsecured notes due on February 2029, and $800 million worth of 5.125% senior unsecured notes due on February 2034, resulting in $4 billion in liquidity, to fund $2 billion in investments during the year.
The stock is down by nearly 10% so far this year, but there are a few key catalysts that could turn things around, most importantly a rate cut by the Fed, later this year. What makes this REIT truly impressive is its diversification across classes, assets, and geographies, leaving it well off in all market conditions. It ended the quarter with $680 million in cash, $26 billion in debt, and $3 billion in cash flow.

Invesco Municipal Trust (VKQ: $7.93, up 2%. Yield=5.1% tax free, or the equivalent of 7.8% taxable)
High Yield Portfolio
The Invesco Municipal Trust is a closed-end fund that invests in tax-free municipal bonds, with the aim of generating steady current income for investors, with limited volatility and downside risks given a long-term horizon. It is a perfect product for retirees and other conservative investors seeking consistent tax-free income, but don’t want to stomach any excessive market risks.
The fund posted a stellar rally starting in October when the Fed officially ended its hawkish stance, but as the anticipation of further rate cuts soured, it has been increasingly rangebound over this year. It is, however, making the most of the higher nominal yields in recent months.
Following two consecutive years of net outflows, $140 billion in 2022, and $8 billion in 2023, muni bonds are set for a turnaround this year. Bonds posted negative performance in April, mostly owing to the better-than-expected employment and inflation data, prompting a hawkish reaction from the Fed. New issuances, however, swelled to $45 billion, 29% over the 5-year average, and were oversubscribed 3.8 times. After several months of limited supply, this quarter presented an opportunity for funds to add yield to their portfolios at an attractive risk-reward proposition.
Despite its phenomenal 22% rally since mid-year 2023, the fund offers an attractive discount of 12% to book value, while providing tax-free yields of 5.15%. This makes for a very impressive proposition, not just for conservative, income-seeking investors, but for speculators seeking value as well. With its extensive 30-year track record and a low expense ratio of just 1.3%, this fund is for those who want no risk from equities.

Good Investing,
Todd Shaver, Founder and CEO
The Bull Market Report
Since 1998

by Scott Martin | Aug 25, 2023 | Weekly Newsletter 7pm Sunday
Market Summary
It's been a bumpy couple of weeks, but baby bull markets tend to sputter a little sometime between the 60- and 120-day mark. With that in mind, this test of investors' courage seems almost foreordained in terms of where it fits in the larger Wall Street cycle. Yes, things were going extremely well. Yes, stocks were racing back to the levels they comfortably commanded before the pandemic inflated and then deflated a bubble. And yes, that rebound is largely justified. We just need to test that justification in order to shake off our residual trauma from the bubble collapse; and the last few years in general.
This is how stocks normally behave. If the bull market has hit a wall this early, it will be the shortest significant rally in modern history. Bull markets generally run for 5-6 years and even in the depths of the Great Depression, the recovery was both more robust and more sustained. Granted, we live in unusually unsettled times, but sooner or later every statistical aberration reverts to the long-term trend. For the S&P 500 and large stocks in general, that means moving up 8-11% a year across the long term. And for Treasury yields, that means about 1% above inflation.
Keep that last part in the back of your head when people try to tell you that 4% bond yields are poison for the stock market. Across generations, inflation has averaged a little over 3% a year. Adding a full percentage point to that "normal" historical level gives you a number above 4%, which means this is where long-term yields should be. If anything, with the latest read on consumer prices coming in at 3.2%, both inflation and interest rates are exactly where they should be under normal circumstances.
Of course, accepting this argument means letting go of a lot of assumptions and expectations that have accumulated over the last 10-15 years. Extremely low interest rates were a historical aberration left over from the 2008 crisis. They needed to come back up, for a lot of reasons. Whether the trigger that gets them back on track is the Fed or a sudden Treasury credit downgrade is secondary. And stocks have historically rallied in the face of exactly this kind of interest rate environment. This is a market fact. Unless you think something fundamental has broken within the American psyche that will prevent us from rising above all current obstacles like we did in the wake of the 2008 crash, or the dotcom crash, or 911, or World War II, or the Great Depression itself for that matter, the numbers are on our side.
In the meantime, the numbers are not great, but they aren't terrible either. The S&P 500 is up 16% YTD, which is accelerated performance when you look at the statistics. Granted, a lot of investors still have wounds left to heal before they really start feeling good about their experience in the last few years, but things are still moving fast in the right direction. The Nasdaq is up a blistering 30% in barely 7 months. Our stocks, balanced between a strong defense and plenty of aggressive growth recommendations, are right in the middle. We've scored a 22% bounce so far this year. In just another 7 percentage points, we'll be back where we were at the end of 2021 ... right before the zero-rate bubble started to rupture.
The big market benchmarks are in a similar state. Even counting the recent pullback, Wall Street as a whole hasn't exactly fallen off a cliff. Stocks are within sight of record territory. And as you know, these relatively rarefied levels near all-time peaks tend to be a little precarious. Investors and traders challenge every move. The bulls need to fight for every inch. Sometimes we need a little time to build up our strength and go over each wall of worry in turn. But it happens. On average, the bulls run for 5-6 years before a real obstacle gets in the way and forces a major downswing. Across each multi-year run, the market as a whole tends to quadruple in value.
In other words, things look a long way from unsustainable or overheated. This is a pause, not a halt. Corporate earnings support this. This has been a mediocre earnings season but the mood has been more hopeful than depressed and a lot of investors have even showed signs of impatience. People can't wait to see the numbers on the current quarter and then guidance for the end of the year. There's a strong sense that by then, the Fed will be finished raising short-term interest rates, which means the pressure on the economy will not get much worse. And when things can't get much worse, they generally get better from there.
Inflation is no longer accelerating. The Fed is getting traction. Earnings across the S&P 500 are not great, but they aren't plunging either. At worst, the tone reads "stagnation," a stall instead of a swoon. That's not a hard landing. Unless the real cliff is coming, this is the soft landing we needed. The recession so mild that it barely even registers after years of disruption, upheaval and, most recently, an economy too strong for anyone's comfort. When investors run from signs of the job market running too hot, it's really a sign that we could all use a break. The economy needs to cool off. That's what the Fed is doing. The alternative is watching prices keep soaring indefinitely, which creates a vicious cycle in which the dollar ends up much lower. Nobody wants that. This is preferable. This is what normal feels like.
There's always a bull market here at The Bull Market Report. As earnings season winds down, the drama has shifted back to the bond market, which shifts The High Yield Investor into the spotlight as we work to explain how rising yields pushed our stocks back down 3% in the last two weeks. As a result, The Big Picture once again revolves around benchmarking the current stock market environment against history, and finds the results highly encouraging. And if you're still paying attention to earnings, we've got plenty of updates for you as always.
Key Market Indicators
-----------------------------------------------------------------------------
The Big Picture: From Baby Bull To Tempestuous Tot
If you’ve already written this bull market off for dead, we have to admit, you’ve given up on the stock market and we can’t help you. For this bull market to have been born in June and dead by August, the economic environment would need to be worse than it was in 1932, in the deepest depths of the Great Recession. That’s when the shortest bull market in modern memory happened. Back then, investors only got two months after rallying 20% from its peak before the bear recouped control of Wall Street. Those were truly bad times.
But even then, investors who bought the brief rally didn’t have a lot to complain about. That two-month rally sent the S&P 500 up a dizzying 91%. The brief but savage retreat that followed took about 30% off that peak, leaving the market roughly 55% off its low. Maybe you think the world is in worse shape now than it was 80 years ago and the market just no longer has what it takes to recover. In that scenario, you’ve effectively given up on stocks, the economy and the American people.
Because in every other crisis over the past eight decades, the bulls got years to run. Other than the 1932 shudder, the shortest modern bull market lasted 1.8 years, before the grim lead into World War II cut the rally short. Only the 2020-2021 pandemic bubble was anywhere near that truncated. It took real determination for the bulls to start running this time around. The mood bottomed out in October and it took eight months for the S&P 500 to recover 20% from that low point. During that period, it became clear that even the Fed’s aggressive rate hikes wouldn’t be severe enough to crash the economy immediately.
And in the absence of that crash, guess what? We survived. Corporations didn’t implode like people feared. A recession like the one we saw in 2008 didn’t happen this time around. We're thinking the recession is already well underway for corporations. Earnings are down from last year. But in the new third quarter, we’re looking for a slight uptick. Even if that doesn’t happen, the comparisons practically guarantee better times ahead for the end of the year. In that scenario, we’ve already lived through the worst of it. Things get better from here. In a few months, members of the S&P 500 will be getting bigger again in the aggregate. The economy will be growing.
That’s good for investors. It’s hard for stocks to go down for long when the economy is feeding more profit across big companies year after year, which is why bull markets are hard to kill once they get going. Admittedly, it isn’t a smooth ride. The first few months of any baby bull are the most intense. But then there’s generally a lull and a pause for the market to test its convictions. Things slow down. People get nervous and start second guessing themselves. But in history, the bull has never backed down this fast. History can bend, but it rarely breaks. If the bear takes over again, we'll be shocked.
Remember, bond yields move in the opposite direction from bond prices. If bonds are falling and rates rising, that means money is pouring out of that particular side of the global financial markets. Within the dollar sphere, money flowing out of bonds means money flows into cash or stocks. Cash is bad news as long as inflation remains high. You might be able to get 4% in money markets, but you’re probably going to lose it all from inflation. Only stocks can make enough right now to keep ahead of inflation. Some may go down instead but the right stocks have a fighting chance. When that’s the best bet you get, you take it. We have the right stocks.
-----------------------------------------------------------------------------
BMR Companies and Commentary
Moderna (MRNA: $101, down 6% last week)
Healthcare Portfolio
Get ready for a good long read on this extraordinary company. This is not a 1- or 2-minute read. It will be 5-10 minutes. So, hang on. Here we go.
Leading biotechnology company and mRNA pioneer, Moderna, released its second quarter results a week ago. The company posted $340 million in revenues, down by a colossal 94% YoY, compared to $4.7 billion a year ago. It further posted a loss of $1.4 billion, or $3.62 per share, against a profit of $2.2 billion, or $5.24. This was largely the result of the seasonal nature of its COVID-19 vaccine sales.
While this was expected as the world moves on from the pandemic, the company, however, expects $6 to $8 billion in revenues from its COVID shot this year, with the US alone expected to buy anywhere between 50 to 100 million doses for the fall. Its updated COVID vaccine, targeting the omicron subvariant XBB.1.5. Is still awaiting FDA approval, but will be ready for a rollout over the coming months.
The company is confident of seeing robust demand for the shot, not just in the US, but also in Europe, Japan, and other leading markets. With COVID-19 becoming ubiquitous, Moderna expects this great business to continue. Far from resting on its laurels, however, it has gone all out to ensure its pandemic windfall is used towards developing more sustainable products.
This includes a robust pipeline of vaccines targeting cancer, heart disease, and a slew of other conditions, and are all set to hit the market by 2030. This pipeline includes its experimental vaccine for respiratory syncytial virus, aimed at adults aged 60 and above, followed by its personalized cancer vaccine in partnership with Merck, which passed its first major clinical trial early last month, with flying colors.
The stock is down by 44% YTD and over 78% from its all-time high in 2021, and as such, is quite de-risked. It currently trades under 4 times sales and 35 times earnings, which might seem rich, but is perfectly justified for a growth stock such as this. It has since repurchased stock worth $1.5 billion and ended the quarter with $8.5 billion in cash, $1.2 billion in debt, and negative $230 million in cash flow. Our Target is $250 and our Sell Price is $150. SO, let’s discuss. These numbers are there for you to decide what to do. And each and every one of you has a different scenario of buying the stock. Some of you bought the stock in January 2023 when we added the stock at $193. Some of you bought the stock beforehand in February 2020 at $26. As the stock has come down from the all-time high of $464 in September of 2021, and more recently from the $218 level in January of this year, you have decisions to make on a day-to-day basis. And all of these decisions are personal, based on a myriad of things that are going on in your life. We could list them here, but you know what we mean here. It comes down to a decision that YOU have to make: Do I sell? Do I stay with it? Do I add more? Tough questions. We highly recommend GTC Stop Orders. Good-‘Til-Canceled orders are orders to sell a stock at a certain price. If it hits the number, the order executes and you are out of the stock. If you bought in January, you could have put a stop order in place to sell at say, $181. Or $171 or whatever price you picked. They used to call this order a Stop Loss order because that’s what it does. Now it is just called a Stop order.
We’re not real happy that the market has drubbed this company the way it has. But we believe in the firm long term, and since we are a long-term investment newsletter, we believe in the companies that we follow and if the stock moves lower, in many cases we like it even more than it was at the higher price. That is the case with Moderna. We would buy the stock here as they have a strong, diverse set of new products coming to market this year, in 2024 and 2025, and beyond.
The future looks bright for Moderna. The company has a strong pipeline of new products, including vaccines for influenza, respiratory syncytial virus (RSV), cytomegalovirus (CMV)*, and HIV. Moderna is also developing a personalized cancer vaccine that could revolutionize the treatment of cancer. The potential dollar size of these markets is enormous. The global market for influenza vaccines is estimated to be worth $8.5 billion, the RSV market is worth $2.5 billion, the CMV market is worth $1.5 billion, and the HIV market is worth $30 billion. Moderna could capture a significant share of these markets with its innovative products.
*CMV is related to the viruses that cause chickenpox, herpes simplex, and mononucleosis. CMV may cycle through periods when it lies dormant and then reactivates.
In addition to its new products, Moderna is also expanding its manufacturing capacity. This will allow the company to meet the growing demand for its vaccines and other products. Moderna is well-positioned to be a major player in the pharmaceutical industry for years to come.
Here are some specific examples of new products that Moderna has in the pipeline. The company is committed to using its mRNA technology to develop innovative new treatments for a wide range of diseases:
A bivalent influenza vaccine that protects against both influenza A and influenza B.
An RSV vaccine that is more effective than existing RSV vaccines.
A CMV vaccine that could prevent congenital CMV infection, which can lead to serious health problems in newborns.
A personalized cancer vaccine that is designed to target the specific mutations in a patient's cancer cells.
The company is worth $39 billion now. At its peak, it was worth $189 billion. Can it go there again in the future? We believe so.

-----------------------------------------------------------------------------
Axcelis Technologies (ACLS: $167, down 5%)
High Technology Portfolio
This company is one of the largest suppliers of capital equipment for the semiconductor industry, leading some industry observers to call it one of the most important companies in the world. During its second quarter, despite a glut in the Chip industry, the company has continued its strong streak, with $270 million in revenues, up 24% YoY, compared to $220 million a year ago. The company posted a profit of $62 million, or $1.86 per share, against $48 million, or $1.43, in addition to a beat on consensus estimates at the top and bottom lines. Its dominant position within this space, amid an industry that in many places has been turned upside down, has resulted in substantial tailwinds for Axcelis, something that is unlikely to subside even in the case of a glut in the market.
Axcelis Technologies ended the quarter with an order backlog of over $1.2 billion, including fresh orders of $200 million. This is largely the result of persistent demand for its Purion family of products, particularly from the silicon carbide power markets. These are semiconductors used in cars, particularly electric vehicles, which are growing fast around the world.
The company’s customers span markets of advanced logic chips, memory chips, and storage chips, all of which are set to witness robust demand, as a result of the unprecedented growth in AI, machine learning, and cloud computing. It is further the only ion implant company capable of providing full-recipe coverage for all power device applications, allowing for high-volume, low-cost manufacturing.
As a result, the company has increased its revenue forecast for the full year by $70 million, giving the stock that is already up by 115% YTD, more reason to rally. Axcelis has a strong balance sheet position with $450 million in cash, just $80 million in debt, and $250 million in cash flow. This puts many lucrative value-creation opportunities, such as dividends and stock repurchases on the horizon going forward. Our Target is $150 and our Sell Price is $125. We are raising the Target today to $195, and the Sell Price to $148.

-----------------------------------------------------------------------------
Roku (ROKU: $79, down 8%)
Early Stage Portfolio
Streaming giant Roku caught another break with its second quarter results a week ago. The company posted $850 million in revenues, up 11% YoY, compared to $760 million a year ago, with a loss of $110 million, or $0.76 per share, down from $112 million, or $0.82, in addition to a beat on consensus estimates on the top and bottom lines.
The company posted strong growth across key operational metrics, with total active accounts at 74 million, up 16% YoY, and reaching a level of 25 billion hours streamed on the platform during the quarter, up by 4 billion hours from last year. The Roku channel now accounts for 1.1% of total TV viewership, establishing it as a leading player in the global streaming space, with plenty of room to grow.
The platform’s average revenue per user slid 7% YoY, to $40.67, but this is mostly owing to a global advertising slowdown, which has since started to turn around, as recessionary fears abate. Roku is perfectly poised to reap rewards from this trend, given its dominance in the connected TV space with a market share of 50% in North America, and billions of dollars of unmonetized ad inventory.
Roku continues to face substantial challenges as a result of supply chain constraints and inflationary pressures, particularly when it comes to its hardware business. Its decision to not pass these additional costs onto customers is what led to the string of losses in recent quarters. This same strategy will pay off in the long run, as it faces stiff competition from the likes of Alphabet TV, Amazon, and Apple TV.
The stock is down by over 85% since its all-time high in 2021 but has posted a 95% rally YTD, amid substantial challenges and headwinds. It currently trades at under 3.5 times sales, which is very reasonable for a growth stock with a landed base and massive competitive moats. Roku ended the quarter with $1.8 billion in cash, just $650 million in debt, and $15 million in cash flow. Our Target is $110 and our Sell Price is $62.
With all of this said, we are not very happy about the fact that the company can’t make a profit. Yes, they have a ton of cash to tide them over the next year or two. But gee whiz, after all these years, WHY CAN’T THEY MAKE A PROFIT? We’ve always said to ourselves: When you are not happy about something, you have to take some action. We’re pretty darn tired of waiting for this one, so yes, their future looks bright, but the stock had better move higher, and if it doesn’t, we are going to move on. The way we like to do this is to set a Stop. We would suggest that you put a Sell Stop in place at $74. If it goes there, we are out. If it goes higher, we will move the stop up accordingly over time.

-----------------------------------------------------------------------------
PayPal (PYPL: $62, down 2%)
Financial Portfolio
PayPal released its second quarter results two weeks ago, reporting $7.3 billion in revenues, up 7% YoY, compared to $6.8 billion a year ago. The company posted a profit of $1.3 billion, or $1.16 per share, against $1.1 billion and $0.93. Despite posting in line with estimates, the stock witnessed a pullback following the results, owing to a slew of factors and operating metrics.
During the quarter, the company processed over $370 billion in payments, across 6.1 billion transactions, up 11% and 10% YoY, respectively. It processed 55 transactions per active account, an increase of 12% YoY, with total active accounts growing to 435 million, up marginally from 428 million during the same period a year ago. It is truly an astounding number of accounts.
PayPal is an online payment platform that facilitates payments between individuals and businesses. It is one of the most popular online payment platforms in the world. PayPal is successful because it is easy to use, secure, and trusted by businesses and consumers alike.
PayPal has a new deal with private-equity giant Kohlberg, Kravis & Roberts. According to this deal, the PE firm will be acquiring PayPal’s ‘Buy Now, Pay Later’ loans originated within the UK and other European countries, to the tune of $44 billion, with $1.8 billion in net proceeds to PayPal set to be realized over the next few months alone. This provides the fintech giant with much-needed liquidity and stability, as it forays deeper into the lucrative consumer credit markets. In addition to this, the company has seen enormous traction with its recent rollout of PayPal Complete Payments, onboarding big ticket channel partners, the likes of Adobe, WooCommerce, Shopify, Stack Payments, and LightSpeed among others.
As PayPal grows by leaps and bounds, it hasn’t lost sight of its promise to continue delivering exceptional value to shareholders, with $1.5 billion being returned via buybacks during the second quarter alone. It plans to scale past $5 billion in buybacks in 2023, giving strong support to the stock, while hardly denting its robust balance sheet, with $11 billion in cash, just $12 billion in debt, and $5.8 billion in cash flow. And the firm is quite profitable, as noted above in the first paragraph. The Target is $125 and we would not sell PayPal.

-----------------------------------------------------------------------------
The Trade Desk (TTD: $75, down 12%)
Early Stage Portfolio
One of the largest demand-side advertising platforms, The Trade Desk released its second quarter results last week, reporting $460 million in revenues, up 23% YoY, compared to $380 million a year ago. The company posted a profit of $140 million, or $0.28 per share, against $100 million, or $0.20, driven by its relentless streak of onboarding new brands, inventory, and partnerships throughout the past year.
Despite a beat on consensus estimates at the top and bottom lines, the market reaction following the results put a damper on the stock’s 100% YTD rally. The results themselves had nothing to warrant an adverse reaction, and in our opinion, this was everything to do with the company’s unjustifiably high valuations of 22 times sales and 290 times earnings, many times higher than the industry average.
The Trade Desk is a technology company that helps businesses buy and sell digital advertising. They are successful because they offer a platform that is easy to use, transparent, and effective. The company has a strong focus on data and analytics, which allows them to help businesses target their ads more effectively. While demand for advertising has hit a rough patch over the past few quarters, the company’s precision and transparency-driven platform has remained resilient nonetheless. Its business development initiatives have made its solutions indispensable for large brands, resulting in a 95% customer retention rate for the ninth consecutive year.
In a niche filled with walled gardens from the likes of Meta and Alphabet, The Trade Desk has succeeded by making this business more accessible to everyone. It has continually gained market share at the expense of its two major competitors, and while the threat of Alphabet’s renewed efforts in this space is substantial, TTD’s expansive moats, industry partnerships, and integrations will not be easy to breach.
The stock was upgraded by many firms on the Street, including Wells Fargo, raising their target to $100 from $82. Piper Sandler has a nice round $100 price target, with Morgan Stanley at $105. During the quarter the company repurchased stock worth over $40 million, with a further $360 million in pending authorizations. This should provide it with much-needed support during volatile times like the present. The Trade Desk ended the quarter with $1.4 billion in cash, a mere $250 million in debt, and $630 million in cash flow. Note: We wrote about The Trade Desk in The Bull Market Report of July 17th. Check it out on the website.

-----------------------------------------------------------------------------
HF Sinclair (DINO: $59, up 8%)
Energy Portfolio
Independent petroleum refiner HF Sinclair released its second quarter results two weeks ago, reporting $7.8 billion in revenues, down 30% YoY, compared to $11.2 billion a year ago. The company posted a profit of $500 million, or $2.60 per share, down from $1.3 billion, or $5.59, but the beat on consensus estimates at the top and bottom lines sent the stock on a strong rally from $51, and the $46 level in July. We added the stock at $61 in December, so the weakness this year has been put behind it.
During the quarter, the company was hurt by the drop in volumes due to the drop in energy prices and the economic slowdown globally, along with a slowdown in refining margins. The gross margin per barrel stood at $22, down 40% YoY, compared to $36 a year ago. This was coupled with lower production of 554,000 barrels of oil per day, down from 627,000 barrels during the second quarter of last year. This is in sharp contrast to the previous quarter, when the company looked upbeat as a result of increasing utilization rates, falling oil refining capacities, and a widening crack spread, owing to the normalization of global energy markets. (Crack Spread is the margin or pricing difference between a barrel of crude oil and the finished petroleum products.)
HF Sinclair is an energy company that produces and sells a variety of fuels, including gasoline, diesel, jet fuel, renewable diesel, specialty lubricant products, specialty chemicals, and specialty and modified asphalt. They have a long history in the energy industry, having been founded in 1916. They have a strong financial position and are committed to innovation. The company used its windfall gains over the past year exceptionally well, paring down debt to $3.6 billion, while offering a well-covered annualized dividend yield of 3%, ending the quarter with $1.6 billion in cash, and $2.5 billion in cash flow during the quarter. Our Target is at $72 and our Sell Price is at $51. This is a solid $11 billion company with a strong management team.

-----------------------------------------------------------------------------
Sunrun (RUN: $16.64, down 5%)
TERMINATING COVERAGE
Photovoltaic cells and energy storage solutions provider Sunrun is riding the post-IRA high life, as evidenced by its second quarter results two weeks ago. The company posted a profit of $55 million, or $0.25 per share, against a loss of $12 million, $0.06. This was still a fairly mixed quarter, with earnings blowing past estimates by a wide margin, with top-line figures coming in below expectations.
Market reactions aside, this was a spectacular quarter for the company, with 103 megawatt hours of fresh installations, up 35%. Total solar energy capacity installations reached 300 megawatts, exceeding the high-end of its guidance at the end of the quarter. Net subscriber value hit $12,320, up by $320 from the prior quarter. Much of this was made possible by the tax credits availed to consumers since the passing of the $700 billion Inflation Reduction Act last year. With tax credits now covering 30% of the installation costs, solar companies such as Sunrun are on a fiery streak.
The company unveiled a slew of new products and initiatives during the quarter, starting with the Sunrun Shift, a home solar subscription that aims at maximizing value under California’s new solar policy. It further signed a partnership with PG&E to develop a distributed power plant that turns home solar storage systems into resources during periods of peak demand, helping prevent blackouts.
Sunrun is an undisputed leader in an industry that is set to hit $400 billion by 2030, and following a 30% YTD pullback, and an 83% decline since its all-time high in 2021, it is trading at a mere 1.5 times sales. The company ended the quarter with $670 million in cash, and over $10 billion in debt which is concerning, but has the assets and is now generating sufficient cash flow to back this up.
With all of this said, we’re not happy with the performance of the firm. After thinking this through long and hard, we believe their marketing philosophy is skewed. The firm offers solar leases, solar loans, and purchase agreements where customers agree to buy the electricity generated by their solar panels for a fixed price over a set period. They don't have to pay upfront for the solar panels, and they don't have to worry about maintenance or repairs. This all sounds great at first glance, but the financing costs for the firm are exorbitant at $10 billion, which is WAY out of line. We added the stock at $29 and we reluctantly exit the stock here. We will be replacing this with a much better solar option in the coming weeks.
-----------------------------------------------------------------------------
Twilio (TWLO: $62, up 1%)
Long-Term Growth Portfolio
Twilio is the leading provider of cloud-based programmable communications solutions. It released its second quarter results last week, reporting $1.0 billion in revenues, up 10% YoY, compared to $940 million a year ago. It posted a profit of $120 million, or $0.54 per share, against a loss of $7 million, or $0.11, coupled with a beat on estimates for the next quarter sending the stock up from the $58 level following the results.
The company hit a rough patch over the past year, owing to persistent macro pressures, which in turn resulted in longer sales cycles, lower deal sizes, and a substantially lower dollar-based net expansion rate* at 103%, compared to 123% a year ago. The slowdown in the social, streaming, and crypto verticals has made things worse, yet Twilio has successfully managed to hold its ground as things start to turn around.
* Dollar-based net expansion rate (DBNER) is a measure of how much revenue you earned from existing customers due to add-ons, upselling, and cross-selling.
Twilio currently has 304,000 active customers on its platform, against 275,000 a year ago, which is largely in line with estimates. The company’s communications revenues led the way at $910 million, up 10% YoY, followed by data and applications at $125 million, up 12%.
Over the past few years, the company has made significant progress in offering a differentiated customer value proposition. It has done this via acquisitions, partnerships, and integrations, which have since resulted in wide, impenetrable moats. The tailwinds as a result of this are only just beginning to be realized and have since prompted a flurry of analyst rate hikes, with the high end of its target at $110.
The stock is up by 23% YTD, but is still off by 86% from its all-time high in 2021 at $457, while trading at a mere 2.8 times sales, making it a fairly priced growth stock. The company completed $500 million in stock repurchases during the quarter, from its $1 billion in authorizations at the beginning of this year. It ended the quarter with a strong balance sheet with $3.7 billion in cash, $1.2 billion in debt, and a stable cash flow position. Will the stock ever reach its all-time high again? We believe so, but certainly not for a few years. In the meantime, we see steady, profitable growth ahead and look forward to breaching our Target of $135. Our Sell Price is $65, with the stock under that price now, as you know, so if you are anxious, set a sell stop at your pain point, say $55 or so. We don’t believe this can happen, but a lot depends on the world economies and all of the potential negatives in the world. We are optimists, as the American economy and markets have grown through thick and thin, through war and viruses, and bull markets and bears, for 200 years. We’ll come through again, of that there is no doubt.

-----------------------------------------------------------------------------
The Bull Market High Yield Investor
It happened like clockwork. Something nudges long-term interest rates above 4% and a perfectly good rally in the stock market evaporates. This week, the trigger was a shock cut to the Treasury’s credit rating, a significant shift in the bond market but not necessarily anything the rest of Wall Street needs to worry about. Most of the big players blew off the downgrade. Warren Buffett, Jamie Dimon, Janet Yellen, everyone. The rating agency that pulled the trigger, Fitch, is relatively minor, with maybe 15% of the global heft in this space. Neither of the true giants spoke up.
And the timing of this downgrade is strange to say the least. It feels like a PR stunt, a desperate reach for relevance. But for now, that 15% of the world that pays attention now needs to adjust its bond portfolios to mirror this move, which means selling Treasury debt to make room for whatever this agency decides is still worth its top rating. Demand for Treasury bonds goes down a bit. And the laws of economics say that when demand for a thing suddenly drops, the price drops with it. When bond prices drop, yields go up. Suddenly yields on the 10-year are above 4%.
This is a historical pain point for the market. Round numbers scare people. The thought is that if you can lock in 4% a year on bonds for the foreseeable future, enough investors will pull their money out of stocks to buy those bonds. But wait a minute. Money flowing out of stocks into bonds means demand for bonds picks up again. Prices in this scenario firm up. And guess what, yields go down. The situation just resolved itself.
That’s how this works. It’s how it worked in 2011 and it’s how it’s going to work now. Yields have had trouble getting above 4% in this cycle. It’s going to take a massive shift in the landscape to get them permanently above that level now. If you’re worried about yields, buy bonds when they hit 4%. And if you’re unwilling to buy bonds at 4%, stick with the stocks that can deliver better under the right circumstances. Beyond that, 4% is just a number.
After all, there are two things here to keep in mind. First and foremost, when long bond yields are stuck at roughly 4% and the Fed has pushed short-term rates well above 5%, the system is showing dramatic signs of stress. That’s the inverted yield curve that tends to foreshadow a recession. The Fed controls the short end. The market decides the long end. When the market keeps buying so many Treasury bonds that long yields stay below short yields, the market is already so fixated on an economic downturn ahead that the prophecy becomes self fulfilling.
But if long-term Treasury yields were to rise back above the short end of the curve, that recession signal goes away. Keep that in mind when people talk about how lethal 4% really is. The only way this curve can heal is if those long yields climb well above 4% or if the Fed wakes up and decides there’s been a terrible mistake. You know the first scenario is the only plausible one. And that’s the second factor to watch. We remember back to 1994, when Treasury yields started at 5.92% and crossed 8% by November. They didn’t get back below 5.5% until 1998. That’s at least four years the world survived yields much higher than 4%, a period in which the S&P 500 doubled. It was the dotcom boom, one of the greatest rallies in history. And it happened in the face of those rates.
What’s lethal about 4% yields? Fear itself. We’ll get through this. Stocks will recover and get back to work. If yields stay above 4%, it’s going to be a lot harder to argue that there’s a recession looming. And if they fall below 4%, where does all that fear go? For now, if you're happy earning 4% a year, bonds are attractive. If you want more, you need to reach for a few of our higher-yield recommendations like the two profiled here.
Apollo Commercial Real Estate Finance (ARI: $10.74, flat. Yield=13.0%)
High Yield Portfolio
New York-based Apollo Commercial Real Estate Finance primarily invests in real estate-backed debt instruments, including senior mortgages and mezzanine loans. The company released its second quarter results recently, reporting $63 million in revenues, up 10% YoY, compared to $57 million a year ago, with a loss of $16 million, or $0.11 per share, against a profit of $50 million, or $0.35. The numbers were weighed down by net realized losses on investments of $82 million, or $0.61 per share, from a subordinate loan backed by an ultra-luxury residential property. This was a significant event, one that saw a $60 million increase to its special current expected credit loss allowance, bringing it to a total of $141 million. This includes an already realized loss of nearly $80 million on the same Manhattan-based ultra-luxurious residential property and is a reflection of the state of New York’s property market, which continues to struggle with a very tough post-COVID recovery.
The company continues to benefit from higher interest rates because 99% of its portfolio is held in floating debt. This led to another consistent quarter of strong distributable earnings of $0.51, well above the quarterly dividend of $0.35. There has been some talk of a dividend cut, but with the level of coverage, we are not concerned. We believe the likelihood of interest rates remaining high for the foreseeable future is quite high.
Leaving this aside, Apollo’s loan portfolio remains as sturdy as ever, with a total portfolio value of $8.3 billion, a weighted average yield of 8.6%, with nearly 94% of them being first mortgages, making this a good place to be in a high-interest rate environment. The trust further funded two first mortgage loans worth $170 million, and received repayments worth $600 million.
The stock is down by 1% YTD, trading at an enticing 27% discount to book value. Apollo ended the quarter with $370 million in cash, $7.0 billion in debt, and $330 million in cash flow.

BlackRock Income Trust (BKT: $11.82, down 2%. Yield=8.9%)
High Yield Portfolio
The BlackRock Income Trust, one of the leading investors in agency mortgage-backed securities and US Government securities offers plenty of value for conservative investors looking for capital preservation, alongside regular income. With its exposure to quality AAA-rated securities, its risk quotient is only a notch below treasuries and munis, while offering higher yields and avenues for capital appreciation.
Ever since the Fed began its hawkish stance, the fund has witnessed a steady pullback and is currently down 6% this year so far. As a result, it offers an enticing 9% dividend yield, all the while trading at a 5% discount to book. With inflation slowing down, and the Fed’s rate hikes finally coming to an end, this fund represents a stellar economic opportunity during the months ahead.
The thing about this fund is that while it may be affected by macroeconomic headwinds and market volatilities in the short term, for investors with a long enough time horizon, the risk of loss is very low. This is made possible thanks to its exposure to mortgage-backed securities, all insured by Fannie Mae, Freddie Mac, and Ginnie Mae, which while not explicitly guaranteed by the US government, we know for a fact that the latter will step in to keep these entities solvent.
The biggest drawback when it comes to investing in the BlackRock Income Trust is the lack of any significant hedges against interest rate risks. During a high-interest rate environment like the present, a portfolio of mortgage servicing rights offers much-needed cushioning against volatility, but they don’t own any, as Rithm Capital and others do. We feel that the company, at current levels, has limited downside risk as the current interest rate levels are very beneficial for the fund.

Good Investing,
Todd Shaver, Founder and CEO
The Bull Market Report
Since 1998

by Todd Shaver | Dec 23, 2019 | Free Newsletter (Sent Weekly Monday at 12pm), Weekly Newsletter 7pm Sunday
The Weekly Summary
December was chaotic last year, keeping investors glued to their screens as we watched a miserable season turn into one of the biggest rebounds in recent memory. This time around, conditions are unusually quiet as a late Thanksgiving turns into a compressed holiday season. Wall Street is already looking toward the Christmas and New Year breaks. So are we.
After all, Santa came early and often this year. The market as a whole has rebounded 28% YTD, handily recovering all ground lost in the 4Q18 rout and then continuing to push into record territory. The S&P 500 has now rallied a healthy 12% past last year's peak, with more than half of that surge coming in the last four months. Whether the motive is relief that we've skirted another year without a recession or more straightforward optimism, the mood is as good as it gets.
If anything, we're inclined to urge a little caution here. When a full 44% of investors are actively bullish and the so-called "greed index" flashing at extreme levels, this is as good a time as ever to take a little profit and rotate the returns back into stocks that haven't flown as far as the rest of your holdings or offer a comparable return for lower risk. The perfect time to buy was a year ago when everyone but us was terrified that the trade war and the Fed had triggered the end of the world. While today this is not an awful entry point, a selective approach can be your friend here . . . we would definitely not pour money into index funds right now.
After all, while the active BMR universe is up 42% so far this year, our stocks have tangible growth on their side. Earnings for the S&P 500, on the other hand, have spent the entire year in a stall, so there's no compelling mathematical reason for the index to keep moving up without straining historical multiples to the bubble point. Right now the market as a whole carries an 18X earnings multiple, well above the 15-16X that investors have normally been willing to pay.
In exchange for those inflated fundamentals, investors are getting negative growth. Those companies are actually tracking lower earnings than they did a year ago, and are likely to keep deteriorating at least into the 4Q19 reporting season. After that, we'll simply have to see if the combination of lower interest rates and a truce in the global trade war shakes a little growth free. If not, stocks will look increasingly vulnerable to any external shock to sentiment . . . the higher the multiples get, the more precipitous the fall from grace becomes.
However, there's a lot to be said for a sympathetic Federal Reserve and any relief from the trade war. The White House estimates that even Phase One in a deal with China coupled with a new NAFTA accord will boost GDP growth 0.5% in the coming year, which is enough to drive a so-so economic expansion into something approaching spectacular. It's definitely far from the recession zone that everyone was worried about a few months ago.
You need growth to decline in order to realistically talk about recession ahead. No decline means no recession. And no recession means people who retreated to the market sidelines are now having a hard time resisting the urge to get back in before they miss out completely.
Remember, while earnings haven't moved up in the past year, they haven't dropped a lot either. The trade war has delayed a lot of new corporate investment initiatives without driving executives to pull the plug on any established cost centers. We haven't seen mass layoffs. No sprawling Financial conglomerates or prominent hedge funds have imploded the last time the Treasury yield curve briefly inverted.
And that curve is healthier than a few months ago. Barring a lot of dread around the coming election, the rate environment once again reflects lower risk in the short term and higher uncertainty farther out into the future, exactly as it should. The Fed has done its work well. Investors have a reason to cheer.
So what can go wrong? While we are always quick to accentuate the positive, we also acknowledge that other investors make errors when the mood swings too far in either direction. Expectations can get stretched to unsustainable levels, setting up the next inevitable round of disappointment, second guessing and nervous selling. That's ultimately a good thing for those of us who have been watching and waiting for a chance to buy great stocks on the dip. Throughout our career (collectively well past a half century actively in the market) the long-term trend always points up and the dip is always worth buying.
There’s always a bull market here at The Bull Market Report! Gary Jefferson has the week off and with the holiday approaching, we decided to use his absence to try something new with an in-depth review of Todd's Stocks For Success. We hope that you come away from this issue with deeper understanding of why our founder likes Berkshire Hathaway so much. He would buy any of these stocks on weakness.
Finally, a scheduling note ahead of the Christmas holiday. The market will close early on Tuesday and stay shut until Thursday morning, so news will be light and our News Flashes will probably taper off a bit. We'll use the time to reflect on the year that's gone and cement our thinking on the year ahead. Ideally we'll also be able to update the site a little and perform other housekeeping as we get the portfolios in position for 2020. We'll be in touch either way, but as always, we wish you a happy holiday and the best possible experience as an investor.
Key Market Indicators
-----------------------------------------------------------------------------
BMR Companies and Commentary
The Big Picture: Big Rally, Narrow Bench
While the last few months have been great for the S&P 500 and our stocks as well, the gains remain restricted to a narrow field of relatively safe bets. Investors simply aren't thinking outside the box right now. They're content to park their money in a few big stocks that don't require a lot of patience or even conviction. While we'd love a little of that capital to flow immediately to a few of our smaller and more neglected recommendations, we don't mind in the slightest.
For one thing, we already recommend many of the leaders. Just seven BMR stocks account for 40% of the S&P 500's gains for the past quarter, and Apple (AAPL: $279, up 2%) alone contributed almost half of that upside. If you weren't bullish on Apple in the last few months, you missed the boat. We were right to keep the giant in our sights, and it gave us everything we hoped to see. Apple has surged a full 77% this year, recovering $700 billion in market capitalization along the way.
Microsoft, Alphabet and to some extent Facebook, Berkshire Hathaway, Johnson & Johnson and Visa also contributed a significant amount to the market's gains in the last few months . . . not to mention the year as a whole. Big stocks got big because the enterprises driving them were some of the most dynamic companies around. This year, they got even bigger. All are hitting all-time highs. How far can they go before taking a break? We'll simply have to see, but as long as earnings keep outperforming everyone else around, the stocks have all the room they need.
Then there's Amazon (AMZN: $1,787, up 1%), which is as dynamic as ever but the stock hasn't gone anywhere in the last quarter. It's also down 12% from its peak, so there's no sense of straining any kind of historical limit. When investors come back, this can once again be a $2,000 stock and a trillion-dollar company. And in that scenario, the S&P 500 gets enough of a boost to break another record. No other stock has to do any work. Amazon can do it on its own.
We see that story play out again and again. A full 3 in 5 S&P 500 constituents are actively lagging the market and the lower you go on the market food chain, the rarer true leadership gets. A staggering 85% of the stocks on Wall Street have underperformed the S&P 500 this quarter. Most are doing okay. True losses are limited. They're simply getting left out.
But the market will never tolerate an imbalance for long. Sooner or later, one or more giants will hit a wall and the money that's flowing to them now will rotate into smaller stocks. When that happens, we'll have a reason to cheer. On average, our recommendations are still down 12% from their 52-week highs, let alone lifetime peak levels. We've come a long way back in the last few months without even clearing what are still formally correction conditions from late in the summer, when Technology took a huge step back. There's money to be made here.
Look at Roku (ROKU: $137, up 3%). It's up close to 350% YTD but is 22% off its peak. That's an opportunity. Even though a handful of giant companies are doing most of Wall Street's work, plenty of smaller names keep breaking records as well. Splunk (SPLK: $151, up 5% this week), for example, is once again within sight of an all-time high, set in early December, capping a year that's literally run rings around the market as a whole. This stock has gained 44% YTD but the ride has been wild. We've seen it plunge from above $140 to below $110 twice this year, so the moral here is to hold on tight through the retreats.
-----------------------------------------------------------------------------
Berkshire Hathaway (BRK-B: $226, flat last week but setting an all-time high)
This stock is a must-own. If you believe in America, then Berkshire is the place to put your money where your mouth is. The stock is worth $553 billion, making it one of the top 10 largest companies in the world. Do you want to know what they do? Well, here it is, straight from Yahoo Finance. Breathe it all in:
Berkshire Hathaway Inc., through its subsidiaries engages in insurance, freight rail transportation, and utility businesses. It provides property and casualty insurance and reinsurance, as well as life, accident, and health reinsurance; and operates railroad systems in North America. The company also generates, transmits, stores, and distributes electricity from natural gas, coal, wind, solar, hydro, nuclear, and geothermal sources; operates natural gas distribution and storage facilities, interstate pipelines, and compressor and meter stations; and holds interest in coal mining assets. In addition, it offers real estate brokerage services; and leases transportation equipment and furniture. Further, the company manufactures boxed chocolates and other confectionery products; specialty chemicals, metal cutting tools, and components for aerospace and power generation applications; flooring, insulation, roofing and engineered, building and engineered components, paints and coatings, and bricks and masonry products, as well as offers homebuilding and manufactured housing finance; recreational vehicles, apparel products, jewelry, and custom picture framing products; and alkaline batteries. Additionally, it manufactures castings, forgings, fasteners/fastener systems, and aerostructures; titanium, steel, and nickel; and seamless pipes and fittings. The company distributes newspapers, televisions, and information; franchises and services quick service restaurants; distributes electronic components; and offers logistics services, grocery and foodservice distribution services, professional aviation training programs, and fractional aircraft ownership programs. In addition, it retails automobiles; furniture, bedding, and accessories; household appliances, electronics, and computers; jewelry, watches, crystal, china, stemware, flatware, gifts, and collectibles; kitchenware; and motorcycle accessories.
Here are the company’s top five holdings:
Apple
Comprising 24% of the Berkshire Hathaway portfolio, Apple represents Buffett's largest holding, with a whopping 250 million shares in the tech giant, as of November 2019. Currently worth approximately $65 billion, in 2018, Apple surpassed Wells Fargo to capture the #1 spot after Berkshire Hathaway purchased additional shares of the Steve Jobs-founded company in February of that year.
Bank of America
Warren Buffett's second-largest holding is in Bank of America, valued at $27 billion and comprising 13% of his portfolio. Buffett's interest in this company began in 2011 when he helped solidify the firm's finances, following the 2008 economic collapse. Investing in Bank of America, which is the nation's second-largest bank by assets, falls in line with Buffett's attraction to financial stocks, including Wells Fargo & Company and American Express (see below).
The Coca-Cola Company
Buffett once claimed to consume at least five cans of Coca-Cola per day, which may explain why the Coca-Cola stock is his third-largest holding. But one thing is for certain: Buffett appreciates the durability of the company’s core product, which has remained virtually unchanged over time, with the exception of the ill-fated "New Coke" formula rebranding, in the mid-1980s. This makes sense, given that Buffett started buying Coca-Cola shares in the late 1980s, following the stock market crash of 1987. Presently with 400,000,000 shares, valued at $22,000,,000,000, Coca-Cola accounts for 10% of the portfolio.
Wells Fargo
At 9% of his portfolio, Buffett currently holds shares valued at over $19 billion. Although this is Buffett's fourth-largest position, Wells Fargo previously occupied the top slot for many years. A series of scandals that began in 2016, including the creation of millions of dummy bank accounts, unauthorized modifications to mortgage plans, and the fraudulent sale of unnecessary car insurance, has hurt the bank's reputation.
American Express
This company is the third financial services company to make Buffett's top five list, occupying 8% of the portfolio. Valued at nearly $18 billion, Buffett acquired his initial stake in the credit card company in 1963, when it sorely needed capital to expand its operations. Buffett has since been a savior to the company, many times over, including during the 2008 financial crisis. With 12.5% average annual return over the past quarter-century, American Express has proven to be a valuable asset.
We’d like to say THEY COVER IT ALL. Again, if you believe in America and free enterprise, you might just want to buy one share of the A series – it’s only $340,000 per share! (A good friend of ours used to call us up at the office back in our Morgan Stanley days in the 1990s and would leave a message: “I just called to place an order for 100 shares.” That’s when the stock sold for $35,000 a share, so 100 shares was worth $3.5 million. He thought this was hilarious! Well, how about now? 100 shares is worth $34 million! HAHA.
What’s the point about all of this hilarity? Get a piece of this company. 10 shares. 100 shares. 1000 shares. Whatever you can afford. You’ll never regret it. Our Target of $230 is about to be breached. We hereby raise it to $255. Our Sell Price remains the same: We would not sell Berkshire Hathaway.

-----------------------------------------------------------------------------
Good Investing,
Todd Shaver, Founder and CEO
The Bull Market Report
Since 1998

by Todd Shaver | Feb 18, 2018 | Weekly Newsletter 7pm Sunday
The Weekly Summary
US stocks rebounded to have the best weekly gain since 2011 - how do you like that for a turnaround? So it turns out the bull is still running after a quick breather. Now all the talk on TV is “don’t worry about volatility. That markets had been abnormally calm for years. That we should now just expect more noise.” We concur. We adhere to the old adage: “Bull markets are born on pessimism, grow on skepticism, mature on optimism, and die on euphoria.” This means that bear markets are born on euphoria and grow on pessimism. Frankly we just don’t see that much euphoria in the markets. For example, while bank stocks are up 50% since the election, profits are up more, which suggests gains in bank stocks are honestly tied to the realities of profit levels. As another example, GDPnow suggests first quarter GDP is above 3.0%, again meeting the growth targets underpinning recent stock market gains. All in all, wake us up when you see broad-based euphoria, because until then this bull market is on cruise control, the ride might be a bit more bumpy going forward.
No matter what is happening out there, there is always a bull market here at The Bull Market Report! This week we highlight: Twilio, Shopify, Square, Splunk, Amazon, and AstraZeneca.
Key Market Measures (Friday’s Close)
----------------------------------------------------------------------------------------
BMR Companies & Commentary
Twilio (TWLO: $33, up 35%)
Twilio crushed the quarter. We mean absolutely crushed it. Revenue was $115 million up 41% from a year ago. EPS was a loss of $0.03 versus breakeven a year ago. There were so many good things that happened we can’t cover them all, but we will share a few.
The tone of business at Twilio continues to be exceptional. Founder/Chairman/CEO Jeff Lawson commented, “We feel we are poised for a great year ahead.”
The big focus for investors was on Twilio’s gross margins. Specifically, after Twilio’s gross margin declined for three consecutive quarters from a peak of 59% in 4Q16, investors were concerned it might continue to trend downwards into the 40s. Twilio’s 4Q17 gross margin of 53.5% was up sequentially from 3Q17. In addition, CFO Lee Kirkpatrick said, “For 2018, you should expect gross margins around this level or better.” That’s a relief!
Uber has been the biggest area of concern for investors. After peaking at $14 million in 4Q16, revenue from Uber declined sequentially three quarters in a row to $5.0 million in 3Q17, but ticked back up to $5.8 million in 4Q17. Despite the drop off in Uber revenue, the company continues to grow the top line greater than 40% and we haven’t seen any other big customers leave, which is a major reassurance.
BMR Take: Founded in 2008, Twilio is the leading cloud platform for communications. Similar to Amazon Web Services, Twilio plays a critical role for software developers by allowing them to easily and securely build communications services, such as voice, messaging, video, and authentication into their software applications and then scale those services elastically and globally. This stock has a bright future and the current valuation of 5x sales is still at an unwarranted discount to the peer group of high-growth cloud communication companies trading for 7x.
----------------------------------------------------------------------------------------
Shopify (SHOP: $138, up 15%)
Another stock crushed earnings for us this week. Shopify. Revenue of $223 million was up 71% from a year ago. EPS was a loss of $0.16 versus a loss of $0.12 a year ago.
2017 was undoubtedly the company’s best year yet. There was exceptional top line growth, but also immense learnings that will drive meaningful progress in terms of product and geographic expansion in the future.
The proof is in the pudding. Fourth quarter is the seasonally strongest of the year with the holidays. Shopify’s merchants sold more in this fourth quarter than in all of 2015, in fact doing $1 billion of sales over just a 4-day period.
For all of 4Q, Shopify’s merchants sold $9.1 billion, an increase of 65% or $3.6 billion from a year ago. This is the definition of sales flying off the shelf. The more Shopify’s merchants sell, the more opportunity there is for Shopify shareholders to make money.
BMR Take: Shopify is a clear leader in commerce, that is building scale, realizing strong growth consistently, and the firm is now considering additional product and geographic expansion to sustain these explosive growth rates for a long time. Revenue is set to double from $675 million in 2017 to $1.4 billion in 2019.
Our Target has been $125 and we wanted to make sure it smashed this target before we raised. Well, “smashed” is the right word here, as the stock shot higher to $140, before dropping a tad on Friday. Yup – an all-time high – never been higher. The company is now worth $14 billion and anyone buying the firm would have to pay $20 billion and we think that management would probably fight any buyout at that level. Why? Because they feel like we do that the company will be worth $30 billion someday. What? Yes. You heard it here first - $250 a share. (We didn’t say when!)
We hereby raise the Target to $160 and the Sell Price from $105 to $122.
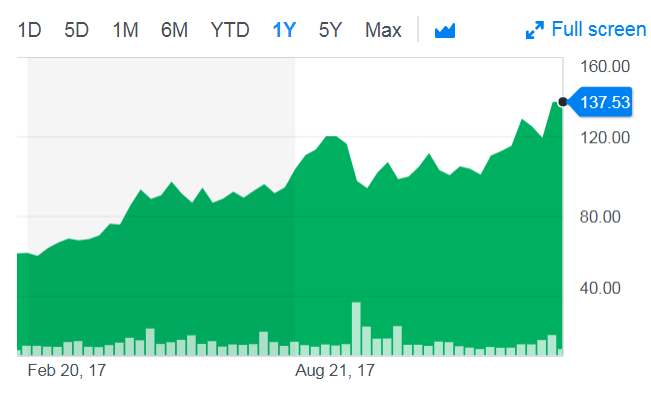
----------------------------------------------------------------------------------------
Square (SQ: $44, up 11%)
The one and only CEO of two publicly traded companies at the same time, Mr. Jack (Billionaire) Dorsey tweeted this week that Square’s Cash App is now up and running for instant buying and selling of bitcoin. We’ll cover the product below, but first the most important point needs to be made.
CEO’s like JP Morgan Jamie Dimon called bitcoin a fraud. Countless more expressed dissent or caution about the new sector. Regardless of what is the truth and what you or we think, the question to ask is what did Jack do? Well, he is already out with a product. It is undeniable that wherever the world is going in payments, Jack and Square are the NextGen warriors that are moving … and moving fast. The innovation is impressive.
According to Square’s Cash App, you can buy and sell bitcoin right from your Square Cash App. You have to fund it with a cash balance and have to read and agree to Square’s virtual currency terms of service, prior to proceeding. Interestingly, the terms of agreement are very onerous giving Square the right to withhold payments if fraud is suspected, for example.
BMR Take: We see Square growing revenue from just under $1 billion 2017 to $1.3 billion in 2018 driving EPS growth from $0.25 to $0.45 over the period. To be honest, we care a lot more about the long run revenue growth than the EPS picture. Visa’s market cap is $275 billion. MasterCard’s is $185 billion. Square is only worth $17 billion today and we believe the company can easily chip away at these giants to find strong growth over the next 10 years.
----------------------------------------------------------------------------------------
Splunk (SPLK: $93, up 7%)
Splunk was up but did not participate in the broad equity market rally as much as it should have. What’s the deal?
The big news was selling by key stakeholders. Activist Jana Partners was a large 5% holder. They exited completely. It was also reported that a Senior VP sold a big block of his stock. Several other prominent investors sold out, like Sands Capital, Clearbridge, and Winslow Capital.
You just have to take note of insider selling. There is no reason to fall in love with any stock. When money has been made, recycle it into the next idea when the time comes.
BMR Take: Splunk is covered by 43 Wall Street analysts. 80% rate the stock a buy. However, the average price target is only $92. (Our Target is $95 which it just hit this week.) With the stock up about 50% over the last year, we are taking a closer look at rotating into a new idea. The risk we see is that with big owners selling, and analysts not raising target valuations higher, we could be in a big correction in sentiment.
So, with that said, we are hereby raising our Sell Price from $83 to $88. If it falls to this level, we are out. Having added the stock at $46 in 2016, we are up exactly 100%. We want to make sure we don’t lose these gains.
----------------------------------------------------------------------------------------
Amazon (AMZN: $1,449, up 8%)
Amazon seems to announce a new disruptive business idea every week. This week Amazon is looking to expand its medical supplies Amazon Business marketplace offering to serve the Healthcare industry. Amazon is pushing to turn its nascent medical-supplies business into a major supplier to U.S. hospitals and outpatient clinics that could compete with incumbent distributors of items from gauze to hip implants.
Amazon has been making moves and dramatically disrupting the Healthcare industry over the last year. In October, analysts and the media noticed that Amazon was granted wholesale distribution licenses for medical devices in several states. CVS Health announced in December it will acquire Aetna for about $69 billion in cash and stock. Many Wall Street analysts said the merger was triggered by concerns Amazon will enter the drug business. Last month, Amazon, Berkshire Hathaway and J.P. Morgan Chase announced a partnership to cut health costs and improve services for employees. The announcement was light on details, but said three top executives from each company will take the lead on the project.
BMR Take: The stock was up $110 this week to another new all-time high! It’s leader is the richest man in the world by far, at $121 billion. Amazon just won’t stop. The company is an innovation machine. They are disrupting new industries seemingly every week. Essentially the company is the world's biggest start-up. There could be $50 billion or more of revenue down the road to come from Healthcare. We say you just have to have Amazon in your portfolio. We know it can look expensive on current revenue and earnings, but we don't know who Amazon will grow up to be yet. It's all still developing.
----------------------------------------------------------------------------------------
AstraZeneca (AZN: $34, up 4%)
There was a big drug development this week. According to the FDA, AstraZeneca has been granted Orphan drug designation for selumetinib (MK-2206 & AZD6244) for the treatment of Neurofibromatosis Type 1 (a disease causing tumors on nerve tissue). AstraZeneca and Merck collaborated to investigate the combination of the two compounds. All development costs are shared jointly. FDA orphan drug designation is primarily a function of the disease not the drug - drugs that target diseases with fewer than 200,000 US patients will be granted orphan designation, and in some cases drugs targeting more than 200,000 patients can be granted the designation when the FDA judges that costs could not otherwise be recovered.
The bigger driver right now is the oncology business. While the company has gone all-out in immuno-oncology, there is more work to be done. The potential of the broader cancer portfolio should see growth in 2018, in part by acquisition. We are excited to see new data and potential acquisitions related to immune-oncology this year. Remember, we are in a new era of fighting cancer that is honestly more exciting to think about than just simply what it means for stocks. It’s a big deal for the world.
BMR Take: We feel AstraZeneca is a strong value here. Revenues are steadily running around $16-17 billion annually. EPS is closing in on $3. Many argue the stock could be worth 20x EPS or more. And you get a 4% dividend yield while you wait. This feels like a profitable situation to us. And if we are wrong, it is hard to see the stock trading too much lower as the dividend yield should hold the stock up.
----------------------------------------------------------------------------------------
----------------------------------------------------------------------------------------
Economic Calendar
Existing Home Sales
Wednesday, February 21st, 10:00 AM
Period: January
Consensus: 5,600,000
Prior: 5,570,000
Initial Claims
Thursday, February 22nd, 8:30 AM
Period: 2/17
Consensus: 230,000
Prior: 230,000
Leading Indicators
Thursday, February 22nd, 10:00 AM
Period: January
Consensus: 0.65%
Prior: 0.60%
----------------------------------------------------------------------------------------
----------------------------------------------------------------------------------------
A Word from Gary Jefferson
Jefferson Financial Group
First Vice-President, Investments
UBS Financial Services, Inc.
Let’s talk about the recent volatility and what happened, why and what's next, and put it all in a historical perspective. The bottom line is that, from peak to trough, the S&P 500 fell 10.2% this month, while the VIX volatility index (^VIX: 19, down 33%) spiked to multi-year highs. We believe that the selloff itself was largely technical in nature, driven by forced selling among investors employing systematic strategies. These strategies are compounded (negatively, in our opinion) by the fact that there are now 5,025 exchange-traded funds (ETFs) trading globally and 9,510 publicly traded mutual funds that are all tied to computerized systems causing redemptions and liquidations of stocks during a market free fall. Yet, there are only about 4,000 companies that are actively traded on the NYSE or Nasdaq. Thus, ETF's and mutual funds outnumber available domestic stocks to own by nearly 4 to 1.
Whether the lows of this correction are in or not, volatility is baked into the cake – the numbers simply won't allow anything less than extreme moves whenever these "systems" are triggered. This brings to mind a quote from Peter Lynch, made nearly 30 years ago: "Everyone has the brainpower to make money in stocks. Not everyone has the stomach." Keeping emotions in check and sticking to the philosophy of being a "long-term" investor are more important today than ever before.
That said, from here, provided the fundamental economic and earnings growth picture remains unchanged (UBS forecasts 4.1% global GDP growth and 16% US earnings growth), we should still be confident that the market will eventually regain its footing.
----------------------------------------------------------------------------------------
Square is Upgraded on the Street
Nomura Instinet reiterated its buy rating for Square (SQ: $44, up 11%) and raised its price target to $64 from $48. This represents a substantial upside potential.
According to Nomura, Square is like Amazon and Google in their early days, meaning that it’s difficult to decode the company’s true potential using traditional valuation methods. Using a discounted cash flow model to value Square, Nomura gave it the highest price target on Wall Street. Amazon and Google have disrupted their industries of course, so this type of pronouncement carried some serious weight in our book.
Square is a financial technology company whose services span payment processing, cash transfer, investing, and lending, an area where it competes with PayPal and Amazon. Square has supplied more than $1.8 billion in loans since launching its credit service in 2014. PayPal and Amazon have loaned about $3.0 billion each.
Over $17 billion in payments processed
Nomura sees Square taking market share from its competitors, which could transform the company’s fortunes in the coming decade. Square processed $17.4 billion in payments in 3Q17, an increase of 31% from 3Q16.
BMR Take: If you’ve been reading The Bull Market Report you’ll know that we love this company and think a lot of its future potential. Our Target is $45 which it reached in November, a bit ahead of schedule. After a pullback at the end of last year which washed out a lot of non-believers, the stock has moved back nicely in the first six weeks of the new year. We can’t WAIT to move our Target up to $53! We are moving up the Sell Price from $32 to $38.

----------------------------------------------------------------------------------------
----------------------------------------------------------------------------------------
The High Yield Investor
By Michael Foster
VP, High Yield
The Bull Market Report
For the Bull Market Report portfolios, the story of the week was the multitude of earnings reports. Two reports came from our High Yield portfolio while the other two came from the REIT portfolio. The recap and analysis of these reports will be covered below, after a brief discussion of the broad market action over the past week. As we noted in last week’s summary, the quick drop in the S&P 500 Index was not a worrisome event. Fear might have taken control of your mind if you paid attention to the general financial media. If you didn’t, you probably saw many opportunities to add more to the positions in your portfolio. One prime example of this, which we’ll talk about in more detail below, is the situation with Apollo Commercial Real Estate Finance (ARI: $18.70, up 6%). The overall market drop pulled Apollo down by approximately 5% since the beginning of February, offering a fantastic price area to pick up shares before their earnings report.
With that said, it’s also true that short term price movements to the upside should not be immediately praised, just as one should not immediately become fearful when a drawdown occurs. While volatility may maintain a presence for the next few weeks, it should die down as the earnings season wraps up and investors realize how positive the 4th quarter was for most companies. Along with that note, inflation fears were slightly quelled after CPI (inflation) numbers were reported under the 2% mark at 1.8% for the month of January.
In relation to our portfolios, all signs are bullish. High Yield and REITs both lagged behind the market bounce last week, indicating slight caution among investors.
AllianzGI Equity & Convertible Income Fund (NIE: $21.53, up 4.5%) has been in line with the S&P’s rebound over the past week. Much of the increase can be attributed to the broad market. The fund’s investment in Tech stocks, in which it holds Microsoft, Alphabet, and Amazon, led to the strong performance for the fund, which comes during the best weekly gain for the Nasdaq since 2011.
Let’s dive deeper into Apollo’s report. As stated above, the dip prior to earnings ended up being a great opportunity and we should be content with this position. The Q4 results were stellar. While the company posted a 29% YoY growth in NII of $69 million, beating the consensus estimates of $68 million, it firm also posted an EPS of $0.12 against the consensus estimate of $0.10. Full-year operating earnings (backing out the CMBS sale – see below) of $191 million or $1.89 per share vs. $137 million in 2016 also helps maintain the bullish thesis. The total loan portfolio at the end of the year was about $3.7 billion, with a weighted average remaining term of 2.8 years and all-in yield of 9%. The company announced dividends of $0.46 per share, which translates to a dividend yield of 10%. The ending book value per share was $16.30 with a P/B ratio of 1.1x. The company also got rid of its loss-creating CMBS portfolio, which had become a lesser focus for ARI. Although the sale of CMBS portfolio resulted in one-time losses, the event was viewed positively by analysts.
Digital Realty Trust (DLR: $102, flat), the second earnings report within the High Yield portfolio, had relatively poor performance compared with the broader market, based on poor Q4 results. It dropped over 3% after the announcement. While the company showed a 27% YoY growth in Q4 revenues to $730 million, the company reported FFO of $1.48, down 6% from the year ago period of $1.58. These numbers led to a small drop in share price. Guidance is generally more important and this area left us reassured: the company reiterated a 2018 outlook for core FFO/share of $6.50 and EPS of $1.50. These numbers were based on assumptions of total revenues equaling $3.1 billion, and adjusted EBITDA margins of 59%.
Invesco Municipal Trust (VKQ: $11.90, up 2%) lagged slightly behind the broader market for the week, with no significant news to note. Nuveen Municipal (NVG: $14.45, up 2%), another fund with major investments in US investment grade municipal bonds, also ended up a bit for the week. We’ll take it. Little by little.
As we move on to the REIT portfolio, one should keep the CPI data that we noted above in mind. Annaly Capital Management (NLY: $10.68, up 5%) had a GREAT week. The company reported Q4 earnings, which was in-line with the consensus estimates. The interest income was down 7% YoY to $745 million in Q4, while core EPS was at $0.31 per share vs $0.30 per share in Q3. The ending book value per share, $11.34, was up from $11.16 in 2016. This represents the stock trading at a significant discount to its book value, so we are in no way paying a premium for this company with an 11.3% dividend yield. In fact, Annaly was another example of the general market in the large February drawdown pulling down a solid company, falling to $10.03 a week ago Friday when the S&P hit its lows. This drop provided prudent investors with bargain prices.
Government Properties (GOV: $16.10, down 2%) underperformed the market. The company posted a 52-week low of $15.63, although it recovered 3% at the close of the week with a sudden spike in volume during the last trading day. The spike should be viewed favorably, as it was the highest level of volume since mid-2017. When selling or buying occurs on small amounts of volume, the movement shouldn’t be taken as seriously as when large volume appears. Since this spike in volume corresponded with buy orders, we remain confident about the position.
Omega Healthcare Investors (OHI: $26.74, up 2%) didn’t fare especially well after posting its Q4 results and 2018 guidance, although the drop was a meager 2%. The company posted Q4 FFO per share at $0.77, in-line with estimates and slightly worse than the $0.84 per share one year ago. Rental revenue was flat at $194 million and missed the consensus of $220 million. The company guided full year FFO for 2018 at $3.00, much lower than the $3.60 reported in the current year. The company stated that 2018 would not be a growth year due to its strategic re-positioning of assets, with an estimated $300 million worth of assets to be sold in 2018. The company increased the dividend to $0.66, leaving the annual yield at close to 10%. However, the company highlighted challenges in increasing the dividend in 2018.
Owning this company requires patience. In past newsletters we’ve highlighted the events occurring within the company, from missed payments by Signature HealthCARE to the Orianna developments. During the earnings conference call, executives made sure to note considerable progress being made with Signature. The firm is in good hands and we can sit tight knowing the attractive dividend yield is being covered nicely by cash flow.
Good Investing,
Todd Shaver, Founder and CEO
The Bull Market Report
Since 1998