July 17, 2019
by Scott Martin | Jul 17, 2019 | 7am News Flash
Johnson & Johnson (JNJ: $133, down 1% this week) has been known to drop as much as 4% in the wake of a perfectly solid quarterly report, so yesterday's relatively minor retreat wasn't a real shock. The important thing is to take the long view.
First, the historical numbers remain healthy. Revenue only dipped 1% to $20.5 billion from last year's $20.8 billion. Our math suggested a deeper drop to $20.3 billion, so an extra $200 million more than we thought coming in last quarter counts as a win. The ailing Medical Device unit held up a little better than we expected, with 7% lower sales almost perfectly balanced against a stronger pulse in Consumer Products and Pharma. Excluding the impact of a weak Chinese yuan and strong U.S. dollar, Johnson & Johnson eked out a little bona fide revenue growth.
Management is confident that Medical Devices are turning around thanks to a revitalized product line in Optical and Cardio equipment along with robust hip replacement sales. In the other categories, a wide range of cancer, hypertension and behavioral drugs did well, creating a fertile sales environment for new therapies coming out of the pipeline soon.
Earnings came in at $2.58 per share, nicely above our $2.46 target. It's great to see our first report of the 2Q19 season give us a number that large, especially when the market as a whole is steeled for a slight earnings decline. If our other recommendations can deliver anything like this, it's going to be a great quarter.
Guidance also improved. Management is now tentatively promising up to 4% sales growth for the full year, which implies more than a little acceleration in the next six months. (Drugs and biotech products are the key drivers of this.) While the earnings target didn't budge, the fact that they're still contemplating up to 6% growth on that side is a good show of confidence.
We like these numbers. And while the market seems more concerned with litigation at this point, management continues to assert complete confidence in decades of Johnson & Johnson product testing. They haven't set money aside for anticipated lawsuit settlements. Legal expenses dropped to $190 million last quarter, down a full 85% from 4Q18.
All these fundamentals are going the right way. And if history is any guide, it might take a few weeks for the stock to start moving in the same direction. That's all we want. Johnson & Johnson will never be a fast stock, but it is extremely reliable.
And on the opposite extreme, we'll see you tomorrow morning with the numbers from Netflix. That one could get a little wild, but for now, we're looking forward to clarity.
This content is for our beloved subscribers and anything you see on this page is just an excerpt!
Please note BullMarket.com access is available to paid subscribers only. Our Members Areas include archives of past Newsletters, News Flashes, our eight portfolios including STOCKS FOR SUCCESS, Healthcare, High Yield, High Technology, Aggressive, Real Estate Investment Trusts, Long Term Growth, and Special Opportunities. Also, all of our in-depth research is available, and more.
Already a subscriber?
Login Here
Ready to join?
Subscribe Now!
July 15, 2019
by Scott Martin | Jul 15, 2019 | Free Newsletter (Sent Weekly Monday at 12pm)
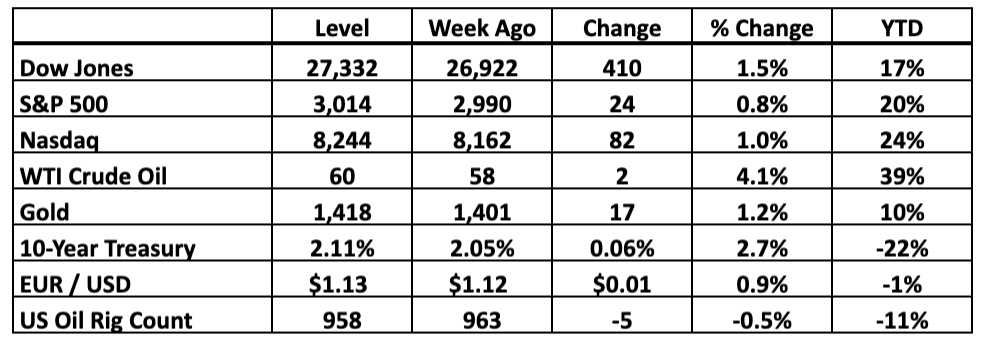
We all got to a week to brag about, with the S&P 500 and Dow industrials pushing through long-awaited milestones (3,000 and 27,000, respectively) and our universe keeping track with another 1.2% net gain. The broad market is finally catching up a little. They’re welcome to share the fun.
At this point the biggest threats to the rally revolve around investor nerve. After another year punctuated with harrowing slides and slightly slower recoveries, the index funds now have 8% to show for the trailing 12 months. That’s roughly what we expect from the market in a typical year. (Our active and closed positions have done a whole lot better in the aggregate, but you know how well you’re doing. If you’re disappointed, let us know. Write us at Info@BullMarket.com )
The danger is that investors simply won’t tolerate average historical returns in exchange for one of the most volatile rides in recent memory. Nerves are still a little frayed after last year’s slide took 20% away from portfolios between Labor Day and Christmas. However, in the absence of new fear factors, we suspect the mental bruises have healed and people are eager to get back to work accepting new records.
Yes, we’re finally back in full Bull Market mode after months of dithering over trade and Fed policy. Now it’s clear that the Fed isn’t going to keep fighting to preserve some abstract higher interest rate objective. Minimal inflation gives them room to take one of last year’s tightening moves away and leave us all with a reversion to more accommodative monetary policy in its place. And as for trade, a return to the status quo is evidently enough to earn applause. We know now what current tariffs mean for our companies. As long as the situation doesn’t degenerate, stocks now reflect all foreseeable downside.
Meanwhile, we’re three months closer to a resolution, whatever shape it takes. Corporate executives have had another quarter to pivot their supply relationships out of China into places like Korea, Japan, Taiwan and especially Vietnam, where we’re told the factories are full of U.S. products ready to ship to our stores free from tariffs. The Chinese domestic market hasn’t closed to our products. If anything, rolling back sanctions on Huawei should boost sales for U.S. Semiconductor manufacturer in the remainder of the year and beyond.
Earnings season starts this week with the first of the big Banks. From there, we’ll see hundreds of concrete examples of how well (or less likely, how badly) every company is bearing up under the current rate environment and trade regime. The rate environment is about to get better, starting with the Fed’s next meeting looming at the end of July. The trade regime has at least stabilized. What other risk factors can get in the way of the rally? We’re open to suggestions. If you’re nervous about anything, you know where to reach us.
There’s always a bull market here at The Bull Market Report! Our Earnings Previews start this week, which only subscribers get, but we're giving you a taste of our thoughts on Johnson & Johnson, which reports tomorrow. The Big Picture is all about the Fed.
Key Market Measures (Friday’s Close)
-----------------------------------------------------------------------------
BMR Companies and Commentary
The Big Picture: Breathing Room For The Yield Curve
We’ve been fielding concerns about the Treasury yield curve since December, when middle-maturity government debt started to pay lower interest rates than shorter-dated counterparts. That’s an unusual situation because normally investors wait longer to get their money back, and naturally demand bigger yields.
The good news is that with the Federal Reserve likely to cut overnight lending rates in a few weeks, the curve is now unwinding what initially looked like an ominous recession pattern. While we’re still in an environment where 3-year Treasury yields are lower (1.81%) than 1-month bills (2.16%) and everything in between, at least the ends of the curve are moving in the right direction again now. A rate cut can make things better and relieve the recession pressure.
Back in March, most Treasury rates were clustered in an extremely tight band between 2.41% and 2.52%, with very little visible logic keeping the lowest rates on the short end and the highest ones reserved for longer-term debt. Investors got less from 5-year notes than 1-year bills, while 1-month bills paid more than 3-year notes. The most ominous thing of all was the extremely narrow spread between all of these maturities, hinting that the bond market had effectively given up on higher rates before 2026 at the earliest.
Since the Fed has historically needed to tighten as the economy expands, scenarios when rates have peaked generally point to a recession ahead. Similar yield curve inversions preceded all previous recessions in living memory, so this one gave the doomsday theorists plenty to talk about.
However, not every inversion foreshadows a recession, especially when the abnormal rate relationships only apply across part of the curve. This time around, the weight on investors’ minds was all about the dynamics of the curve itself and not the underlying economy. The Fed is tackling that confusion at the source.
Last year we heard persistent complaints that 3% is a hard ceiling for 10-year bond yields. Whenever long-term rates got that high for an extended period, stock investors got nervous and fled to the relative safety of bonds, pushing prices up and bringing the yields back down to “tolerable” levels.
(Remember, prices and yields always move in opposite directions, whether you’re dealing with Treasury bonds or our dividend-oriented recommendations. Buying low locks in a high effective return. Buying high locks in less real income.)
But while the far end of the yield curve became capped at 3%, the Fed kept pulling the near end up 0.25% per quarter throughout last year, compressing what was once 1.50% of room between the extremes to barely 0.48% today. After all, when the Fed makes overnight borrowing 0.25% more expensive, the rates on longer-dated loans need to go up too. That’s exactly what happened. Since the end of 2017, the Fed raised the overnight rate from 1.25% to 2.50% and 1-month Treasury yields moved up from 1.29% to peak at 2.51%.
Meanwhile, 10-year yields remained stalled at 3.0% and dipped to 2.0% when the market shuddered, forcing every point on the curve in between to flatten out or even drop below overnight rates. That’s just the return investors were willing to accept in exchange for relative safety. They weren’t looking for big interest. All they wanted was a secure place to park their funds.
Since the Fed acknowledged that it’s willing to not only “be patient” about future rate hikes but actively cut in order to keep the economy on track, the short end has plunged 0.35% to 2.16%, and a month from now it will be even lower. Longer-maturity bond rates have dropped too, but not as much. There’s now a fraction of a point more room between the extremes.
The curve is getting steeper again in the right direction, with the near end dropping and the far end staying roughly where it was. If 3.0% was the ceiling on the far side, evidently the only way to buy a little breathing space was to reduce pressure on shorter-term rates. That’s the only part the Fed controls, and it’s doing so now.
What this means for us is simple. First, as bond rates start declining again, investors need to look elsewhere to earn real income. That’s constructive for our High-Yield recommendations that pay a lot higher rates in exchange for what we consider only fractionally higher risk.
In general, lower bond yields support higher earnings multiples. Old-school valuation techniques suggest that a stock worth 13X earnings in a 3% world can go all the way to 20X when the Treasury market pays just 2%. We don’t anticipate huge moves from the Fed, but if you were worried about stocks getting frothy, the story is about to change.
And needless to say, cheaper money helps corporate executives dream a little bigger. They can fund larger and more transformative acquisitions or simply borrow enough to buy back more stock. Those with relatively weak balance sheets (we can’t think of any on the BMR list) get a second chance to clean things up before their debt starts choking them.
Throughout the process, consumers can keep spending without feeling the drag when the monthly bills come in. Lower rates are a boon for housing and auto markets. In a struggling economy, that’s the cushion that keeps the wheels turning. When the only apparent problems are tensions overseas and a persistent absence of inflation at home, the bulls get plenty of room to run.
Sooner or later recessions become inevitable. But with the Fed on the move, the yield curve now looks more like what we experienced in 1998 than any real pre-recession rate shock. Back then, Alan Greenspan jumped to correct a partial inversion in the face of tensions overseas. It took 33 months for the economy to contract. Investors who bailed out on stocks on the first glitch on the curve missed out on a 50% move higher and had plenty of time to reposition themselves when it was clear that the party was finally over.
The party’s not over yet. We might have years to let our winners ride. Either way, we’ll be watching . . . and the Fed is alert as well.
-----------------------------------------------------------------------------
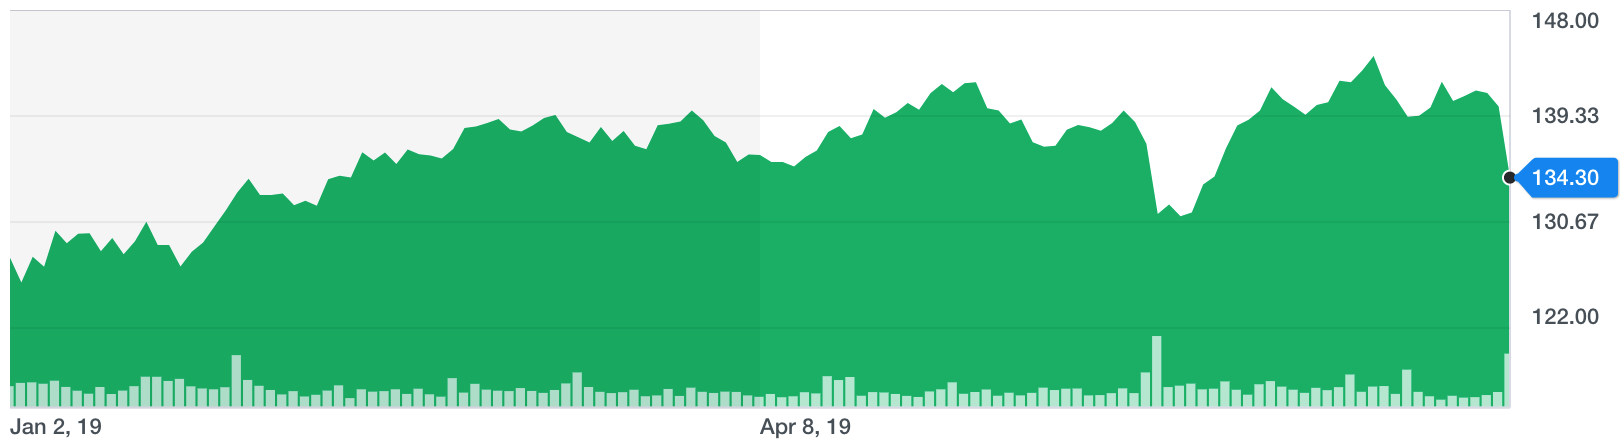
Earnings Preview: Johnson & Johnson (JNJ: $134, down 4%)
Earnings Date: Tuesday, 8:00 AM ET
Expectations: 2Q19
Revenue: $20.3 billion
Net Profit: $6.6 billion
EPS: $2.44
Year Ago Quarter Results
Revenue: $20.8 billion
Net Profit: $6.1 billion
EPS: $2.10
Implied Revenue Decline: 2%
Implied EPS Growth: 16%
Target: $150
Sell Price: We would not sell Johnson & Johnson.
Date Added: July 6, 2018
BMR Performance: 10%
Key Things To Watch For in the Quarter
Reports of a potential criminal investigation into the company’s talcum powder testing rocked the market on Friday, but we’ve seen similar headlines over the years and none of them have kept the company down for long. Even when judges have awarded massive damages to people who say they developed cancer after using Johnson powder, the judgments keep getting thrown out on appeal. The overhang just hasn’t turned into material financial liability yet.
Granted, legal costs have become a perpetual drag on Johnson & Johnson’s results, so we’ll be watching those figures Tuesday morning. Last quarter the company spent $400 million on lawyers. If that’s the status quo for the foreseeable future, the expense is built into the regular SEC statements now. Instead, we’re open to an upside surprise as management uses its $14 billion in cash (with another $4.5 billion coming in every quarter) to keep shareholders on deck.
The dividend has climbed to $0.95 per share, so short of a Boeing-style PR disaster we aren’t looking for a huge bump on the quarterly distribution here. However, buybacks are another story. We estimate that Johnson & Johnson has bought and retired 300 million shares over the past year, boosting its per-share earnings growth even as overall performance has been a little less impressive. There’s easily enough cash here to soak up another 200 million shares over the next 12 months.
But we’re not convinced Johnson & Johnson needs that much help in the long run. Sentiment may be skittish when the legal headlines get intense, but the fundamentals keep ticking forward, year after year. A slight revenue retreat this time around is all about the struggling Medical Device unit, which accounts for 30% of the company and keeps stealing focus from persistent growth from the much-better-performing Pharmaceutical operation. Factor out Medical Devices and the impact of a strong dollar and Johnson & Johnson is growing the top line about as fast as the market as a whole.
That’s all we really need this gigantic company to do. We’re here to capture that 2.8% yield while the giant keeps absorbing vibrant new Consumer and Medical brands and letting weaker operations go. The odds of that narrative adding up to big rewards over the long term are heavily weighted in our favor.
NOTE: In our weekly paid subscription Newsletter, we do between 5 and 7 SnapShots and also support regular Research Reports. The last three stocks we recommended are already up 5% apiece. Plus, we have the Weekly High Yield Investor, whereby we discuss the 17 stocks in our High Yield and REIT Portfolios.
And to top it all off, we send News Flashes each day during the week. Got a question about any stock on the market? We'll answer. So if your favorite stock reports earnings or there is significant news, you will hear about it here first. If you want the whole picture, join the thousands of Bull Market Report readers who are making money in the stock market and subscribe here:
www.BullMarket.com/subscription
It’s only $249 a year, and later this year we will be raising it to $499 or even $999 a year, it is just THAT valuable. But we will lock you in for life at this lower price.
Good Investing,
Todd Shaver, Founder and CEO
The Bull Market Report
Since 1998
Subscribe HERE:
www.BullMarket.com/subscription
Just $249 a year, soon to go up to $499. But you are guaranteed the SAME PRICE forever.
July 8, 2019
by Scott Martin | Jul 8, 2019 | Free Newsletter (Sent Weekly Monday at 12pm)
When holidays break up the market week, a lot of investors simply check out until developments get more interesting. This was not one of those weeks. In the wake of an epochal Federal Reserve meeting and a make-or-break thaw on trade talks, nobody wanted to get trapped on the sidelines while all the fun was happening on Wall Street.
The S&P 500 is now not only breaking records on a regular basis but nudging toward the psychologically important 3,000-point line we suspected it could conquer before trade policy clouded the picture. The Nasdaq is back above 8,000 and even the rarefied Dow industrials, hamstrung by setbacks for many of its bellwether constituents, looks set to crack 27,000 for the first time in history.
As this past week demonstrates, investors have a right to be thrilled. BMR recommendations climbed 2.3%, eclipsing all the major indices as stocks on our list that once looked a little tired got a second wind.
With the exception of our most defensive Healthcare and High Yield portfolios, just about every major segment of the BMR universe beat the market. The core Stocks For Success group gained 3.0% and Technology jumped 3.4%, but even when you get down to the volatile Aggressive portfolio most of our names are in the money and ahead of the game.
We also got outside confirmation of that outperformance this week. First, our submission to this year’s MoneyShow Top Stock Picks competition did better than any of the other 100 participating market watchers put forward. Yes, we gave them Roku (ROKU: $98, up 8% this week), which has climbed so fast that we’re once again approaching triple-the-money returns there since 14 months ago when we added it, and we came out #1 in the competition! We still love this stock. It’s hard not to, when it’s up another 22% since the MoneyShow numbers were compiled at the end of June.
But victory is not just about one stock. Counting dividends, our active universe is up 35% YTD, which is great even by our standards. For comparison, the S&P 500 is up 19% over the same period and is in the throes of its biggest rally since 1997. However, in a year when only two mutual fund managers on prestigious lists scored even 3 percentage points better than we did, it’s nice to see that we’re not only delivering absolute numbers but staying far ahead of the pack.
In this position, our strategy revolves around expanding the lead and resisting the urge to change what clearly isn’t broken. Our recommendations are working. The ones that fizzled are gone, replaced with the most attractive stocks the market gives us in the present. As the economy shifts, we’ll shift with it. For now, no course correction is required.
Earnings are coming. The trade situation has stopped escalating to the downside. Everyone hopes the Fed will cut interest rates at the end of the month, especially after Friday’s unemployment number came in a little higher than expected. Jay Powell will give us some hints in his Congressional testimony later this week. And our companies are still racking up cash a lot faster than the market as a whole.
There’s always a bull market here at The Bull Market Report! The Big Picture takes advantage of the last lull before earnings season (our Previews start next week, which only subscribers get) and then it's good to check in on one of our biggest and steadiest stocks.
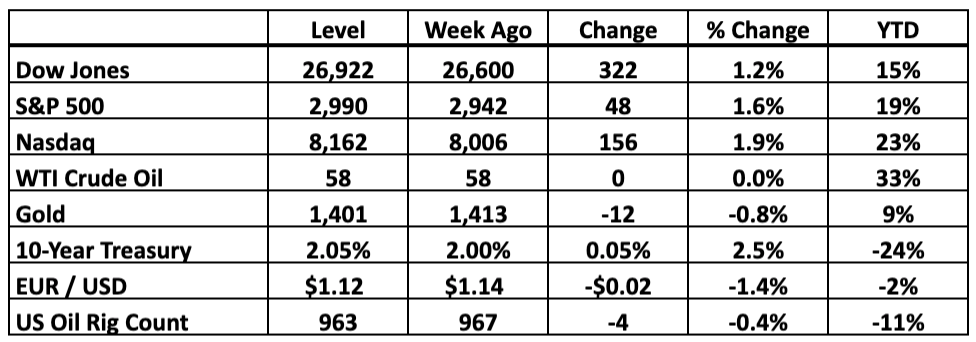
Key Market Measures (Friday’s Close)
-----------------------------------------------------------------------------
BMR Companies and Commentary
The Big Picture: Get Ahead Of The Earnings Crush
It happens every 90 days with the big Banks officially starting the 2Q19 earnings season. We’ll see this next Monday, which means this is the last Bull Market Report before the flow of Previews and Reviews starts up again next week. As such, we have an opening here to provide a few strategic notes that will apply throughout the cycle.
First, in terms of timing, you can expect our season to start relatively calmly with Johnson & Johnson the morning of July 16 followed fast by Netflix (NFLX: $381, up 4%), The Blackstone Group (BX: $47, up 6%) and mighty Microsoft (MSFT: $137, up 2%). Every one of them will go a long way toward setting the tone for the market as a whole to follow, with the Technology names likely to grab more than their share of headlines. We’ll say more about them all in the days leading up to their numbers.
The real fun starts the week after, when almost 25% of our recommendations that report quarterly results are on the calendar, and then we wrap up July with a surge of 20 BMR companies crowded into a five-day period. After that, the flow tapers down fast. While we’ll keep reading 10-Q filings through early September, they’ll be more about weighing stock-specific nuances than figuring out the broad strokes.
For us, the broad strokes will be in place after July 30 with numbers from Apple (AAPL: $204, up 3%). Three weeks from now, we’ll have a pretty good sense of how our entire universe did last quarter and the business conditions their management teams see ahead. From there, we can extrapolate most of what’s going on elsewhere and then, if the numbers are as good as we expect, we’ll have 10 weeks to ride the wave.
That’s what every earnings season is all about. The day the 10-Q gets filed, we have absolute certainty on how well the company did in the trailing period. When our projections deviate from that reality, we adjust, and when that revised outlook changes investors’ sense of what the company is worth, the stock goes up or down in response.
But then the quarterly clock starts ticking again. The farther from that moment of 10-Q clarity we are, the more room Wall Street’s targets get to drift away from corporate reality. Eventually that drift reaches the point of maximum uncertainty and investors are more likely than ever to miss crucial clues that can sink or surge the stock.
We prefer to get most of our uncertainty out of the way as early in the cycle as we can. That way, we know what’s going on inside our stocks before other investors figure it out. If we need to raise our Targets or pivot out of a stock that’s finally hit a cash flow wall, we can do it while Wall Street is still off balance and under a cloud of suspense. And the market’s map of the new quarter’s winners fills in, we’re in a better position to make the first moves.
A few weeks from now, we’ll know which moves (if any) to make. For now, we already recommend all the stocks we can’t resist. There isn’t a lot of sizzle out there that isn’t already in the BMR portfolios. The market as a whole is still looking at 2% earnings deterioration this quarter, with growth not coming back until the end of the year. The BMR universe, on the other hand, remains on track to deliver 3% growth.
Our earnings targets have actually come up a little over the last three months. Despite all the noise distracting Wall Street since April, the signal is brighter than ever. Remember, most of our stocks have nothing to do with China. And they’re expanding sales fast enough to fight rising labor costs and other pressures on the bottom line. We’re in the hot spots. As they demonstrate that heat over the next few weeks, it’s likely that other investors will start jumping to our end of the market instead of the other way around.
-----------------------------------------------------------------------------
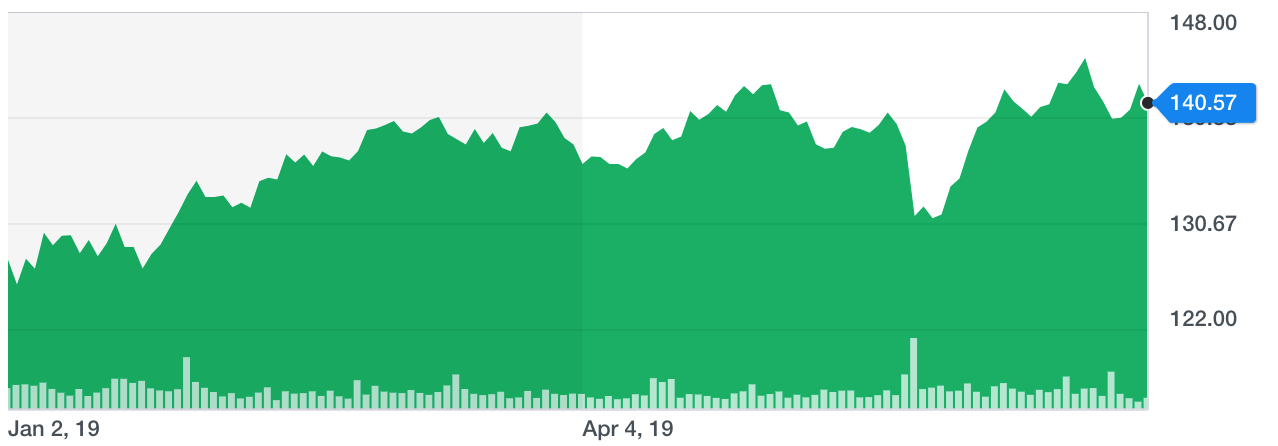
Johnson & Johnson (JNJ: $141, up 1%)
Aside from being an industry Blue Chip, this is one of the most dependable companies in existence – one of only two companies with a AAA credit rating (the other is Microsoft, another BMR pick). For reference, the United States government has a AA+ rating, so Johnson & Johnson is actually more creditworthy than the federal government.
J&J is a truly diversified Healthcare company, with a major Pharma presence. The company has a strong pipeline of drugs, with the FDA’s recent approval of Darzalex in combination with a Celgene drug for multiple myeloma patients adding another potential large revenue driver. Darzalex is already a blockbuster drug ($2 billion in sales last year), and now it can expand its market share (experts are predicting as much as $3 billion in revenue for 2019).
On top of that, the company announced plans for a Drazalex follow-up by partnering with Genmab (whom they partnered with on Darzalex) to create Hexabody-CD38. The beauty of the deal is Genmab will spend the upfront time and resources to prove that Hexabody has market potential, and only then will Johnson & Johnson decide whether to license the product. Thus there is limited downside here for J&J, and the company could land yet another multiple myeloma blockbuster like Darzalex.
The 1Q19 numbers were just okay, with U.S. sales up 2% YoY to $10 billion, while international sales fell 2% to $10 billion. The $20 billion in revenue per quarter has remained steady throughout the year, and illustrates just how consistent and dependable J&J is. With a $370 billion market cap in the Healthcare space, we’re not looking for massive growth here, just safe, consistent performance.
BMR Take: The stock is up 10% YTD, and the dividend of 2.7% is one of the most bankable in existence. That’s important given the overall market volatility. Remember, Healthcare is a defensive sector that’s primed to outperform during market downturns. Right now though, we’re looking at slow and steady growth for J&J, which is exactly what we expect. This is one of the few companies we would not sell here at BMR.
NOTE: In our weekly paid subscription Newsletter, we do between 5 and 7 SnapShots and also support regular Research Reports. The last three stocks we recommended are already up 5% apiece. Plus, we have the Weekly High Yield Investor, whereby we discuss the 17 stocks in our High Yield and REIT Portfolios.
And to top it all off, we send News Flashes each day during the week. Got a question about any stock on the market? We'll answer. So if your favorite stock reports earnings or there is significant news, you will hear about it here first. If you want the whole picture, join the thousands of Bull Market Report readers who are making money in the stock market and subscribe here:
www.BullMarket.com/subscription
It’s only $249 a year, and later this year we will be raising it to $499 or even $999 a year, it is just THAT valuable. But we will lock you in for life at this lower price.
Good Investing,
Todd Shaver, Founder and CEO
The Bull Market Report
Since 1998
Subscribe HERE:
www.BullMarket.com/subscription
Just $249 a year, soon to go up to $499. But you are guaranteed the SAME PRICE forever.
July 31, 2016
![THE BULL MARKET REPORT for August 1, 2016]()
by Todd Shaver | Jul 31, 2016 | Weekly Newsletter 7pm Sunday
Economy is Steady but Slower than Expected
This week has been a busy one as many longstanding financial deals and events have come to pass. The Federal Reserve is leaving rates unchanged for now as Brexit is fading into the past a bit, although the Fed has suggested they may raise rates as early as next month. The Democratic National Convention has formally nominated Hilary Clinton, as Bernie Sanders fully endorsed her, securing party unity. The race is on – The Donald vs. The Hilary. We hope you realize that we don’t make predictions in politics here at The Bull Market Report and we find it very difficult to predict what the markets may do if one or the other is victorious. Anyone who claims they know is just grasping at straws in our opinion.
Apple reported earnings this week and we cover it at great length just below. Alphabet investors are also hoping to see an increase in operating margins alongside a 17% increase in revenue. These stocks and more are covered in more details below.
U.S. economic growth unexpectedly remained lukewarm in the second quarter. We saw business investment weakening further with inventories falling for the first time in five years, despite strong consumer spending. GDP increased at a 1.25% annual rate according to the Commerce Department. And they said the 3rd and 4th quarters look weak as well. They are looking for GDP to come in around the 1% mark. Economists aren’t as pessimistic going forward, as they believe consumers will continue their high spending levels.
Excluding inventories, GDP growth rose at a 2.4% rate and domestic demand increased at a 2.7% pace, not really all that bad. Interest rates should remain low, although the Fed is hinting of raising in the next few months. But what else is new? They’ve been threatening this for years. They raised in December and look what happened in January. We think little or nothing will happen on the interest rate front for many months.

The Bull Market Report Companies and Commentary:
Apple (AAPL: $104, up 6%)
Apple saw a big move higher this Wednesday after reporting earnings that exceeded analysts’ predictions. Raymond James Financial recently upgraded the company from a “market perform” to an “outperform” rating. The target price is now $129, which is about a 33% increase from last week’s close of $97. Our Target is $140 and we do not have a Sell Price, as we have said many times that if the stock goes to $90 or $85, we would buy more.
Apple ran up 6% Wednesday to close at a three-month high. The split-adjusted price gain of $6.30 was the second-biggest one-day rise in Apple’s history, due to the better-than-expected quarterly results. It was close to the biggest-ever gain of $7.10 on April 25, 2012. (A 7-for-1 stock split went into effect on June, 2014, meaning the actual April 2012 price gain was really $50).
Apple reported revenues of $42.4 billion and quarterly net income of $7.8 billion with EPS of $1.42. Last year, Apple had revenues of $49.6 billion and net income of $10.7 billion with EPS of $1.85 in fiscal 3Q15. Revenues fell 14.5% YoY driven by lower iPhone sales and a 33% decline in sales from Greater China.
iPhone revenue fell 27% $24.0 billion in fiscal 3Q16 from $33 billion in fiscal 3Q15. iPhone unit shipments also fell 21% to 40 million units from 51 million units in the same period last year.
Revenue from services rose 19% to almost $6 billion from $5 billion. Services revenue accounted for 14% of Apple’s total revenue in fiscal 3Q16, a rise from 10% a year ago. The Services segment is now the second-largest revenue producer for Apple. It consists of revenue from the iTunes, App Store, AppleCare, and Apple Pay businesses. Apple’s App Store revenue rose 37% YoY. The CEO of Apple, Tim Cook, stated, “In the last 12 months, our Services revenue is up almost $4 billion year on year to $23 billion, and we expect it to be the size of a Fortune 100 company next year. Most of our terrific Services performance during the quarter was fueled by our active installed base of devices, with installed base-related purchases of $10.3 billion accelerating to 29% growth year on year.”
This is interesting: Warrant Buffett disclosed in May that his Berkshire Hathaway owned 10 million shares of Apple as of the end of the first quarter. We knew this but hadn’t focused on it recently. We wonder if he is adding to his position.
Listen, we know that this wasn’t a great quarter for Apple as iPhone shipments in China fell 25% YoY to 7.3 million units. This was steeper than its worldwide unit sales decline last quarter of 15%. Part of the iPhone shipment decline in China is related to the company’s effort last quarter to reduce its bloated sales channel inventory. Tim Cook had this to say: "By far, the largest portion of our global channel inventory reduction was in Greater China, so our underlying business there is stronger than our results imply." But, note that Apple's iPhone installed base in China has grown by 34% over the last year alone.
Apple also announced this week that the billionth iPhone had been sold. Plus 2016 marks an even numbered year in which Apple generally launches another flagship product. We should see the iPhone 7 in September.
And finally, we note that Apple raised $7 billion this week in the bond markets through a complex bond sale. Listen to these low interest rates they received: They sold notes consisting of $350 million maturing in 2019 with a floating interest rate based 14 points over three month LIBOR; $1.15 billion maturing in 2019 with a fixed 1.1% interest rate; $1.25 billion maturing in 2021 with a fixed 1.55% interest rate; $2.25 billion maturing in 2026 with a fixed 2.45% interest rate; and $2 billion maturing in 2046 with a fixed 3.85% interest rate. That’s the beauty of having a AA+ bond rating on Wall Street.
BMR TAKE: The bad news: Two down earnings quarters in a row. The good news: Apple is still selling iPhones like crazy (40 million in the quarter) and they have $232 billion in cash with just $70 billion in long term debt. We are buyers here at $104 and expect many more good things coming from the company this year and next.
Google (GOOG: $769, up 3%) reported blowout earnings this week for 2Q16. Google (Alphabet) shocked Wall Street by posting earnings of $8.42 per share, smashing the consensus of $8.04 per share. Revenue also beat consensus by $1 billion, coming in at $21 billion, up 21% from a year ago.
Google’s market cap is trying to catch Apple. The company is valued at $538 billion with Apple at $571 billion. Of course, Google is at their all-time highs and Apple is off 30% from theirs. It’s going to be an interesting dog fight from here on out. We hope it’s a dead heat.
Many analyst firms upped their targets for Alphabet. Credit Suisse raised their target from $920 to $940. Pacific Crest moves from $910 to $960, and Stifel Nicolaus raised its target from $888 to $925. Goldman Sachs upped their target from $810 to $930, while Morgan Stanley analysts moved from $865 to $880 per share. The Bull Market Report has a target of $850 and if it hits that Target you can be assured that we will raise it to $1000 or more. Our Sell Price? We would not sell Google.
BMR TAKE: See the last sentence above!
Facebook (FB: $124, up 2.5%)
Facebook defied all previous expectations as it reported stellar second-quarter earnings. Sales totaled $6.4 billion for the quarter, 59% more than the same period a year ago. Facebook has an active count of 1.7 billion monthly users. The company makes an average of $14 per user per year in United States and Canada, its most important markets. Mobile advertising revenue for Facebook represents approximately 84% of total revenue, an increase of nearly 8% from last year.
Facebook has come across a problem, one that’s actually a good one. The company is running out of space to display more advertisements, the crux of the business. Instead of cramming more in there, it is focusing on developing more targeted and better performing ads. It hopes to remedy this by producing commercial grade advertisements while continuing to add new Facebook users at a constant rate.
Last quarter Facebook added 60 million new users to its base. Facebook is a company that is adept at shifting towards new ad formats and incorporating them into its core business. This is evident in the desktop to mobile switch that occurred in the past five years. Facebook easily captured all of that revenue, showing it’s a company that can shift with the times.
Dig this: Facebook just passed Berkshire Hathaway in market cap. Facebook: $360 billion. Berkshire Hathaway (BRK.A, $216,000 (not a misprint!), $356 billion. Who’s going to win this race? We have our money on Facebook. Don’t get us wrong. We LOVE Warren, but we are backing Zuckerberg with our cash.
Facebook had its price target raised by analysts at Credit Suisse from $145 to $154 on Thursday. This is a 24% upside from current prices. They now have an "outperform" rating on the stock. Our Target is $140 and we are going to hold that here. But we are raising our Sell Price from $105 to $115.
Home Depot (HD: $138, up 1%)
This home improvement store has constantly outperformed over the past 10 years, through thick and thin, with “thin” being the housing crash of 2008-2011. The stock is up over 300% since 2006. Home Depot can count itself among the ranks of other blue-chip stocks. During July, Home Depot’s stock was up 6%.
No major events seem to be affecting the stock at the moment. Home Depot remains as safe a buy as ever for investors. There is a lot of upside to continuing to invest in this company, as more people require home services. The company’s earnings report will be coming out on August 16th.
Gilead Sciences (GILD: $79)
This company had a terrible week, dropping 8%. The company reported last week that it had $7.8 billion in revenue and $3.08 in EPS. Estimates had called for $3.02 in EPS on revenue of $7.8 billion. A year ago it posted EPS of $3.15 and $8.25 billion in revenue. Revenues down a bit, earnings down a bit, but so far, not so bad.
Gilead repurchased $1 billion of stock in open market in the 2Q16 after the $8 billion buyback in 1Q16. They have a strong balance sheet consisting of $25 billion in cash, $24 billion of debt, and nearly $20 billion in cash flow per year so we expect more stock buybacks, but certainly not at the pace of the first quarter. They will be spending more money on R&D instead of buying back stock. OK by us.
Another reason for the pullback was that a few firms lowered their ratings on the stock. Credit Suisse still has a Buy rating but lowered its price target to $115 from $120. Barclays reiterated an Overweight rating. S&P Equity Research reiterated a Strong Buy rating.
We are not too happy about the stock lately. We think the selling is way overdone as consensus has earnings for 2016 of $11.80. That puts the stock at a PE of 7. Downright silly. Our Sell Price is “We would not sell this stock,” but what worries us is not so much the company, but the stock market as a whole. We don’t believe the stock market will fall from here, but IF IT DOES, then a rising tide lifts all boats with the opposite true as well. Please read between the lines here and be careful.
Kinder Morgan (KMI: $20, down 3%) The stock was down a little for the week, but up from the $18-19 level a month ago. The company restructured significantly in 2014 and it has taken two years for the market to digest what the company has done. They rolled all of the their limited partnerships into one entity. (We like.) They cut the dividend by 75% from 50 cents to 12.5 cents (which they paid last week.) This is a yield of 2.5% down from a yield of 3-4 times that. Forget crude. We believe it has a lot to do with the price of natural gas, which has run from $1.55 earlier this year to the $2.75 level. Their balance sheet is strong now with the dividend cut and the sale of an electric utility (why were they in electricity delivery?) They got $1.5 billion from that sale and it went right to paying down debt.
Revenue has been down just a bit over the past two years, but earnings after non-recurring items have actually been steady. We don’t like the company’s long term debt situation. It’s very high and thus highly leveraged. So for that reason we are going to watch this one like a hawk. Our Target is $27 which we are going to leave there, but we are raising our Sell Price from $15 to $18, the price we added the stock at in February. If it hits that level we are out. The high debt level worries us.
Twitter (TWTR: $16.64, down 9%) had a bad week. They reported decelerating revenue growth for 2Q16 and forecast lower-than-expected revenue for 3Q16. Shares fell 15% on Wednesday but bounced a bit on Thursday and Friday. The stock actually had a good run in July starting at this same level, rising to the $18 level, and now dropping back to where it started at the beginning of July.
Revenue was $602 million, in the top half of the company's guidance range for the quarter of $590 - $610 million. Some are saying that 2Q16 YoY revenue growth of 20%, which was down from 1Q16 YoY growth of 36%, is disappointing. But advertising revenue - 90% of the company’s total revenue - increased 18%. Not bad, but lower than the 35% growth in 1Q. Earnings were 13 cents vs. 15 cents a year ago.
Future: Management guided for 3Q revenue in the range of $590 - $610 million, but consensus expectations are for 3Q revenue of $680 million. This is one reason why the stock got hammered.
Average monthly active users reached 313 million, up 3% YoY. But engagement and daily active usage improved. Management said: “This growth was driven by marketing initiatives, organic growth and product improvements, including better relevance in both the enhanced timeline and push notifications. We are seeing the direct benefit of recent product changes, and with disciplined execution, we believe we can drive improved engagement and audience growth over time.”
BMR TAKE: The company is going through a huge internal turnaround and it may or may not work out. If it doesn’t, the stock is going to $10. If it does, we can see $20 or $25. With $2.4 billion of revenues, it’s certainly not going out of business. We like it better here at $16 rather than its all-time high of $69, and $52 a little over a year ago. Will Apple buy them out? Will Google? Will Facebook? Maybe. Maybe not. (Will Donald Trump? He sure is an advocate!) So if this one is too hot for you, get out of the kitchen. We are watching and waiting.
HIGH YIELD CORNER
We are moving this section up a little higher in The Bull Market Report because it is our best performing portfolio. Not only are the stocks in this portfolio paying 5% and 8% and 10% and higher, but the stocks themselves are up 5% and 15% and 25% and more! We generally think of stocks in the High Yield portfolio as being slow and a bot boring and STEADY.) But with the stocks up so much we are loving it.
Are cracks showing in the world of high yield investments?
We've seen many weeks of persistent strength for many high yield asset classes, so it's no surprise that some would start to take a break. This isn't a cause for concern, but some investors might worry that any pause in the continued bull market for high yield might be the beginning of a turn. While this may be true, a sudden free-fall is unlikely to come in the short term because of several tailwinds at the backs of some of these investments.
To understand those tailwinds, let's first consider the big news: the GDP report. Second quarter expectations were upgraded several times from several quarters, with 2.6% growth the average estimate before Friday's bombshell: actually GDP growth was less than half that, at a meager 1.2%. Markets rallied on the bad news, as paradoxical as that might seem, for one simple reason: We now can expect a more dovish position from the Federal Reserve.
That's why the 10-year U.S. Treasury fell to 1.45% on Friday, reversing an increase that we have seen in July as Brexit fears were replaced with macro optimism. But America's economic recovery isn't as great as many may have expected, and so Janet Yellen company will have no choice but to pause the interest rate hikes - which are inherently bad for high yield investments - for the foreseeable future. Thus high yield assets rallied on Friday after a sluggish week.
Weak growth means a monetary policy that will benefit high yield, but it doesn't mean companies are going to struggle to pay their bills and cause a rife of corporate defaults. That's good news for BDCs and junk bonds, which would decline in value if bankruptcies began to accelerate. Why are we so confident that companies can continue debt payments? Simple: despite the weak economic growth, the U.S. consumer is actually gaining ground.
Within the Census Bureau's data was a startling and somewhat paradoxical data point: household purchases rose 4.2%, the strongest growth rate in two years. That's a continuation of the first quarter of this year, when retail sales rose 8% YoY. Even as the U.S. economy stumbles, consumer spending is not.
What this means is that companies exposed to the Retail world will continue to survive, even if they don't thrive. High yield investments exposed to Retail will also continue to do well.
This means REITs that specialize in anything retail related - strip mall REITs, hotel REITs, and apartment REITs - will be fine. If anything, they may see funds from operations (FFO) grow as more activity in those sectors creates expansion opportunities and drives higher rents.
This is good news for Bull Market Report pick Kimco Realty (KIM: $32), which rose 2% this week and is up 21% year-to-date and 17% since we added it on March 24th. Kimco's specialty in outdoor shopping centers and strip malls, and its portfolio of top tier tenants, makes it a great hold even though it has surpassed our previous target price. This is why we are upgrading Kimco with a new target sell price of $38, which is likely to come later this year. If there is a market correction and Kimco falls, it will just be a great opportunity to buy more. We are raising our Sell Price from $25 to $28. All of this can be found on the website, of course, at https://www.bullmarket.com/high-yield
Similarly, a stronger consumer means more Americans will have fewer problems paying their mortgages, or buying new homes, especially if mortgage rates continue to sink with the U.S. Treasury rates. This is great for the secondary mortgage market, which in turn is great for Pimco Dynamic Income Fund (PDI: $29), another Bull Market Report favorite that is up 3% over the last week. Like Kimco, the Dynamic Income Fund has just edged past our previous sell price and so we are again upgrading the fund with a new Target of $33 (and a new Sell Price of $24, up from $21.) With continued strength in the mortgage backed security market where the fund invests, finding income should remain no problem for the fund--and a strong special dividend at the end of the year is becoming likelier than ever, especially as the fund has recorded a significant amount of undistributed net income over its last fiscal year.
A final word about the high yield market: The iShares High yield Corporate Bond ETF (JNK: $85) fell 1% last week but remains up 6% year to date. With several weeks of strength and a raging bull market since February, this decline appears worrying on the surface. However, we remain unconcerned for the reasons stated above. With default rates remaining at a similar, albeit slightly elevated level, junk bonds remain attractive as a hold in funds like the Pimco Dynamic Income Fund. While some future slight declines in value may affect high junk bond funds that are poorly allocated to underperforming companies, our picks are managed much better than that. This again demonstrates the need to choose high yield assets carefully.
The same goes even more for BDCs, which is why Main Street Capital (MAIN: $33, up 1%) remains a favorite. This is an extremely well managed Business Development Company and one of the few to grow NAV (Net Asset Value), dividends, and share price since inception. The company's ability to consistently provide value is also the reason why we have our Target price at $40, a level far above the BDC's NAV and a level it only briefly touched in early 2014. We do not expect it to reach that Target any time soon, if ever - and that's a good thing, because we don't want to sell MAIN and lose out on the 6% yield and special dividend upside.
That’s all for now on High Yield. Suffice it to say that we are very pleased to have these consistently high returns (stock appreciation and dividend) in this portfolio, in the midst of a very turbulent world.
Thoughts from Gary Jefferson
First Vice-President, Investments
Jefferson Financial Group
UBS Financial Services, Inc.
Earnings season heated up this past week with a whole host of big names reporting. According to Thomson Reuters, 65% of S&P companies that reported earnings so far have beat Wall Street estimates.
Art Cashin (managing director of UBS Financial Services) said last week, "Earnings slipped but not as much as some had feared…." Normally, that would in and of itself not be enough to spark a stock rally. So what is behind the recent move to new highs? If we had to guess it would be because investors like a low interest rate and no recession environment. And, they like the US market better than the rest – there are few places around the globe to invest that have the appeal of today's US equity market. As one market guru recently commented, "If the US stock market is the de facto standard bearer for global equities, then this new move higher is only in its early stages and will steal the thunder from the political theatre we're all having to endure".
Well, that may be stretching it somewhat since the S&P500 is trading at 19 times trailing 12-month earnings. If stocks go higher they will need higher earnings (which have to be supported by rising sales). Fortunately, the consensus forecast is for higher earnings for both the 3rd and 4th quarters. And, one has to remember that many groups of stocks endured bear markets over the past year. For example, the iShares Nasdaq Biotechnology ETF is still down 30% from its August 2015 high. Many other sectors are at or near highs but have yet to "break out". As we repeatedly say, "it is all about earnings, earnings and earnings".
The US dollar staged a massive breakout that could snap the greenback out of a 16-month funk. We’ve already seen the effects of a stronger dollar on crude. Oil topped out at $51 in early June and has slowly dropped lower ever since. At $41/barrel, it’s now 20% off its highs.
All of this brings to mind one of the oldest and most respected stock market epigrams: "Stocks always climb a wall of worry". Meaning, without worry there would be no opportunities in the stock market. There's plenty to worry about – oil, the dollar, rates, the election, Brexit, China and terrorism, just to name a few. What we see is a wall that will crumble under the pressure of good earnings notwithstanding all the worries. Likewise, we see a wall that the market likely can't climb over should earnings surprise to the downside. The majority of experts believe the earnings will be there, and if they are right the market should continue to climb its way higher by year end.
Thank you, Gary Jefferson.
Whole Foods Market (WFM: $31, down 10%) The company’s results for this quarter were not good. L&F Capital Management refers to them as “Not that appetizing” and this certainly seems accurate. Their latest quarter can only be described as weak. Earnings have been sliding and show no signs of reversing. Comparable store sales haven’t increased in an entire year, decreasing by 3% in this last quarter.
The shares, which have declined 18% in the past 12 months, trades at 22 times forward earnings, compared with the competition at 19.
"The most worrisome development about Whole Foods' latest results is the continued sales deceleration heading into 2017," Pivotal Research Group wrote in a note.
The company is getting badly hit by competition from cheaper alternatives such as Kroger, Wegmans and H-E-B supermarkets, which have successfully expanded into fresh and organic products that Whole Foods pioneered. Walter Robb, co-CEO, added: “That’s the world we’re in, and customers have lots of choices.”
Whole Foods has responded by lowering prices on produce. Robb noted that customers are “trading down” to cheaper products, too. On top of the discounts, Whole Foods has launched a pilot loyalty program that will cut into profits even more.
Whole Foods, dubbed as "Whole Paycheck" for its lofty prices, has been spending heavily on a new chain called "365 by Whole Foods Market", which offers lower prices.
In the last year, net income fell by 22%. Free Cash Flow margin is also very low at 1.1%. Revenue of $3.7 billion missed estimates and on Tuesday, Goldman Sachs cut Whole Foods to a sell. Until then, their view on the retailing chain had been neutral. They had this to say on the subject; “Whole Foods is experiencing a competitive barrage, losing share in its core natural and organic business to a variety of players.” When asked about Whole Foods’ long-term potential, they stated that “Wellness has gone mass market, and it is not coming back, never again to be relegated to niche specialty retailers serving price-insensitive, early adopters.”
Goldman Sachs just might be correct when they spoke negatively of Whole Foods’ long-term potential. Analysts believe that a turnaround in sales will not come quickly, especially given the decline in comparable-store sales. L&F Capital Management is skeptical of the long-term potential as well. During a previous cycle, they presented an original bear thesis in which they suggested that “the mainstreaming of natural organics” presented great risk to a company such as Whole Foods. It certainly seems to be coming true, given the numbers from this quarter.
The company has discussed a plan to improve on costs and spending. If it works, the plan could save them $300 million in annual expenses, but given the rising costs of healthcare expenses that the chain continues to face, there is some speculation as to just how feasible such a plan is. Gross margins have declined a full point to 35%, but the company claims that it is intentional, as it is part of a recently engineered strategy aiming to lower their prices. This strategy includes an anticipated decline of 200 more basis points.
BMR TAKE: It seems that the organic foods giant has become too successful for their own good. The stiff spike in competition that we are seeing is troubling and only seems to be getting worse. Management has expressed deep concerns regarding the competition and if they are concerned, then we should be as well. Unfortunately this appears to be a good time to exit Whole Foods Markets. We added the stock in January at $29 so we are going to eke out a profit here, but we are not at all happy. We are just tired of waiting and waiting and waiting. We hereby remove it from our Stocks for Success.
Mazor Robotics (MZOR: $23) had a great week, up 13%. It’s still a relatively small cap at just less than $500 million, and the company is certainly a buyout candidate for one of the big Healthcare stocks. We like this one a lot. Let’s see what happened this week. Well, for one thing, Medtronic (MDT) is set to enter the robotic surgery market through a partnership deal with Mazor. As you know, Mazor manufactures robotic systems, specifically the Renaissance Guidance System, which is used for spinal surgeries.
The US robotic surgery market is dominated by Intuitive Surgical (ISRG). Another recent major entrant in this market space is Verb Surgical, a joint venture of Johnson & Johnson (JNJ) and Google.
The Medtronic-Mazor partnership includes co-development, co-promotion, and global distribution for some of Mazor’s spine products. Medtronic is expected to invest about $50 million in three separate cash infusions. Initially, the deal entails a co-promotion phase in the United States. If the expected milestones in this phase are met by the end of 2017, Medtronic will gain the sales and distribution rights of Mazor’s future spine product sales. Medtronic will earn commission on sales of the products, and Mazor will earn the consumable and service revenues. The Renaissance Guidance System will continue to be sold and distributed by Mazor.
The Renaissance Guidance System enables surgeons to execute spine and brain surgeries more accurately and more safely. It allows the surgeon to execute minimally invasive guided procedures instead of freehand surgery, thus reducing risks of complications during surgery. The system also reduces the patient’s exposure to radiation due to the minimal need for X-rays. Radiation levels in robotic-assisted surgeries are 56% lower than in traditional surgeries. Also, patients are found to have a shorter recovery time and better outcomes.
Mazor Robotics sells its Renaissance Guidance System on the “razor and blades” business model similar to Intuitive Surgical’s (and Gillette.) The Renaissance Guidance System sells for $850,000. The disposables sell for $1,500 per procedure. In comparison, Intuitive Surgical’s system sells for $1.5 million on average, and the disposables cost $1,840 per procedure. Surgeons have used the Mazor Renaissance Guidance System over 12,000 times for spinal surgery successfully.
BMR Take: We like 13% up-weeks. We are looking for a much higher stock ahead. We hereby raise the Target from $25 to $29 and the Sell Price from $14 to $18.
That’s it for this week.
Good Investing,
Todd Shaver
Editor in Chief