
Special Note: We are going to publish our 2nd Earnings Preview Monday morning. Netflix (NFLX) is the first to report Monday after the close and then there are a bunch on Wednesday – Kinder Morgan and Qualcomm, and a few more on Thursday. We can’t wait to send it to you.
LAST WEEK: Oil prices continued to strongly influence U.S. equities, and on the whole, with crude rallying sharply on news of potential Saudi and Russian production freezes, markets enjoyed bullish sentiment. Sledding was a bit tougher last week than the one before, however, as earnings season kicked into full swing - causing market participants to exercise a bit more caution, even in the wake of the previous week’s dovish interest rate posture from the Fed.
No Deal From Doha:
Oil ministers from around the world are meeting over the weekend in the Qatar city of Doha. In times past this might have sent Crude prices soaring and equity prices tumbling. The exact opposite was the case last week with Crude virtually unchanged and stocks enjoying a good week, across the board.
Investors have come to discount any outward signs of unity in this group. Politics is where this group has nothing in common. So, no reliable agreement restricting output is in store. We think very little will come out of this meeting as Iran has not agreed to appear. Saudi Arabia is upset and going to close the store and take all their marbles home like a sore loser. The net result is that they will continue to produce oil at high levels, which can only cause lower prices since demand is so low worldwide. We’ll know more later this week.
THIS JUST IN: No Oil-Freeze Deal at Doha Meeting
Delegates from more than a dozen oil-producing countries who gathered in Qatar this weekend hoping to freeze crude output failed to clinch a deal, according to ministers leaving the meeting late Sunday. It was unclear if oil officials from Russia and Saudi Arabia, the world's two biggest producers, and most OPEC members, would try to reconvene again, either later Sunday night or on Monday.
The futures just opened. Stocks down 11 S&P points; crude down $2.50 to $37.65. Nasty.
Here is how the week ended:
| Key Market Measures - Friday Close | |||
| Dow Jones | 17,898 | +321 | +1.8% |
| S&P 500: | 2,081 | +34 | +1.7% |
| Nasdaq | 4,938 | +23 | +0.5% |
| Crude Oil: | $40 | UNCH. | UNCH. |
| Gold: | 1,236 | -6 | -0.5% |
Fire the Forecasters: What Inflation?
Last week was just chock full of market moving data. In last week’s Bull Market Report we listed the estimates of all of Wall Street’s leading economic soothsayers. The only trouble is, these expert forecasters missed every estimate with the exception of one. What is the adage about a blind squirrel finding an acorn?
Inflation, or the lack thereof, was the spark that ignited Tuesday’s rally. The key Producer Price Index was down 0.1% for March compared to a 0.3% increase expected. The March PPI included the price spike in Crude. This means the core PPI dropped more like 0.2%. Very quickly investors realized this news put a dagger in the hearts of the Fed’s interest rate hawks. The only logical thing that followed was to buy stocks aggressively. And that is pretty much what drove the markets to levels within striking distance of all-time highs.
Investors were further encouraged by Thursday’s lower than expected report of The Consumer Price Index and Core CPI. If this trend in data continues in the months ahead, the Fed will have no reason to increase interest rates anytime this year.
Financial Stocks Back from the Abyss
At long last, Financial stocks came to life as the group ushered in the 1Q16 round of earning reports. JPMorgan Chase (JPM, $62, up 7% for the week) provided the spark on Wednesday with better than expected results. To be clear, applying the term “better than expected” really means, “less miserable than we feared”. Those fears are based on factors like the Y/Y decline in stock prices, a soft underwriting calendar, and paper-thin interest spreads. Wall Street expectations were reduced to the minimum. Stocks got taken to the proverbial cleaners. That is what makes financial stocks like these so attractive: Bank of America (BAC: $14.00, up 9% for the week), Goldman Sachs Group (GS: $159, up 5%), The Blackstone Group (BX: $29, up 8%) and Annaly Capital Management (NLY: $10.40, unch.) Any half-decent news and these stocks will take flight higher.
Note that we saw a successful IPO this week. Shares of BATS Global Markets (BATS) jumped 21% to $23 after the exchange operator went public, the first non-healthcare IPO of 2016.
Auto Market In Trouble
The recent unveiling of Tesla’s Model 3 so far has resulted in reservations for nearly 400,000 units of the sleek new $35,000 model. The first deliveries won’t take place until the next president of the United States delivers his or her first State of the Union address in 2018 but thus far, Elon Musk has succeeded in raising $400 million in capital without the need of an investment banker or filing a registration statement with the SEC, all from the $1,000 deposit put down by its buyers. Pretty smooth work Elon! No wonder the stock is approaching its 2015 high.
As for the rest of the Auto industry, things are not so great. We have been digging through lots of data for months now that point to a slowdown. Wednesday’s data on retail sales confirmed it has happened. Except for Tesla, we have no other recommendations in the Auto industry for which we are quite happy. However, since autos, along with housing, have formed the backbone of economic strength for several years, this is not great news in general for investors.
A Fiscal Fix Is Needed
If, as we have often suggested, monetary policy has run out of gas, how does the economy get fuel for growth? For the past 75 years, the answer was simply, have Congress spend more money. With $20 trillion debt and a Congress that is frozen, spending more is not an option.
We see that the big problem the Fed fails to recognize is the quality of the US labor force in relation to the high paying skills needed. Worker skills in a manufacturing economy are a poor match with the preponderance of high paying jobs being created in Technology. And with technology changing so rapidly, today’s job skills are becoming obsolete faster than any time in history. There is a major gap here as Silicon Valley and the whole Tech industry has thousands of unfilled jobs while the true level of unemployment, the E6 number, remains close to 10%. (E6 is the broad measurement of unemployment including people who are unsuccessful long term job seekers that have left the labor force entirely. In other words this includes people that lack the skills to fill existing job vacancies.)
With this in mind, we applaud this week’s announcement by Oracle chairman Larry Ellison. He is donating $200 million to the government’s effort to train students in computer coding. This is creative fiscal stimulus. If the concept spreads throughout the Tech community, it could create new opportunities for investors. Keep your fingers crossed. Smart thinking Mr. Ellison.
Upcoming Economic News
This week the Washington Data Machine shifts from inflation to housing. Monday, Tuesday and Wednesday are the days to watch. Existing Home Sales is the most likely to have market impact, as this has been weak recently.
On a broader scale, the total Housing picture is important to stocks, since Housing, like Autos have been key economic drivers. We will be keeping an eye on this data sending out our thoughts during the week.
| Release TIME (ET) | REPORT Title | PERIOD | FORECAST | PREVIOUS | |
| MONDAY, APRIL 18 | |||||
| 10:00 AM | Home Builders' Index | April | -- | 58 | |
| TUESDAY, APRIL 19 | |||||
| 8:30 AM | Housing Starts | March | -- | 1.18 million | |
| 8:30 AM | Building Permits | March | -- | 1.18 million | |
| WEDNESDAY, APRIL 20 | |||||
| 10:00 AM | Existing Home Sales | March | -- | 5.1 million | |
| THURSDAY, APRIL 21 | |||||
| 8:30 AM | Weekly Jobless Claims | 4/16 | N/A | N/A | |
| 8:30 AM | Philly Fed | April | -- | 12.4 | |
| 8:30 AM | Chicago Fed National Activity Index | March | -- | -0.29 | |
| 10:00 AM | Leading Indicators | March | -- | 0.1% | |
| FRIDAY, APRIL 22 | |||||
| 9:45 AM | Market PMI Flash | April | -- | 51.5 | |
High Yield Corner
It was another great week for High Yield. All sectors ended the week in the green, including a surprising resurgence in the world of MLPs. Alerian MLP ETF (AMLP: $11.04, up 1.3% for the week), which has struggled significantly throughout the year. Even in weeks when oil surged, MLPs failed to recover, so this week’s movement is significant. The movement also came on no news, which may suggest investors are calling a bottom in this asset class.
Caution is needed here. MLPs are closely correlated to many asset classes, including the S&P 500. Already some analysts are calling for a pullback after the market has skyrocketed 12% since its lows in January. Whether that happens or not depends on earnings season, which has just started. Unfortunately, things kicked off poorly with Alcoa (AA: $10.00) seeing sales fall 15% on a Y/Y basis, guiding lower due to a disappointing growth rate was the Airline sector. The company will cut an extra 1,000 jobs.
Things aren’t all bad, though. The banks are actually doing very well, with strong earnings results coming from Citigroup (C: $45) and JP Morgan (JPM: $62) offsetting news of Goldman Sachs's (GS: $159) $5 billion settlement for fraudulent transactions related to the 2008 crash. This is good news for the BDC world, as seen by the strong showing of the UBS Wells Fargo BDC ETF (BDCS: $20), which ended the week up 1%. As lenders to mid-sized companies, BDCs are benefitting from the same tailwind helping the big banks: More lending activity for companies as they begin investing more heavily in growth.
Similarly, high yield bonds - as seen in the iShares High Yield Corporate Bond Fund (HYG, $82) - rose over 1% for the week as investors forgot their fears of growing defaults in the Energy sector spreading to the rest of the market. The week’s action left HYG up over 2.5% YTD and BDCS flat YTD, excluding dividends.
Property REITs, as seen in the SPDR Dow Jones REIT ETF (RWR: $94), were the weakest this week, essentially closing flat after a strong Friday showing. We are two weeks away from the REIT earnings season, and this will be a crucial one. Many REITs are still down in the past year after a significant pullback, even if funds from operations (FFO) show a strong Y/Y growth rate. Now that sentiment is improving, REITs will need to show more FFO growth to get their stock to rise further. If they fail, a sharp reversal of the 9% gain over the last three months may be in order.
The Options Corner
We thought we would show you a concept of attempting to produce fairly strong returns by buying a stock and immediately selling an at-the-money call on it. This is a strategy for sophisticated investors only, so get your broker and advisor involved before you try any of these ideas because in the short few paragraphs below it is impossible to tell you about all the scenarios that can play out. So by definition, this description will be somewhat superficial. AND RISKY. But we are looking to produce a 10% gain in a month or two. Did we say RISKY?
The concept is this: Buy a stock you like and that you think the stock might stay steady or go up in the next 30-60 days. Then immediately sell an at-the-money call on it. Let’s look at some numbers. How about one of favorites Solar City (SCTY: $29, up 4% last week). Say you buy 1000 shares at $29. Then you sell the May $30 call, which is trading for $2.25.
The cost of the stock is $29,000. But selling the 30 call brings in $2.25 per share or $2,250. So your net cost is $26,750 [($29-$2.25 = $26.75) x 1000 shares]. If the stock stays at $30 or higher until the expiration of the option on May 20th (3rd Friday of the month for ALL options), your stock will be called away at $30, which is exactly what we want to happen in this trade. Let’s look at your cash position. After the stock is called you will receive $30,000 for the stock and since your investment was $26,750, you will have made $3,250 for a return of 12% in a month. Not bad.
Let’s look at a negative scenario? What is the downside risk? (After all, no one is going to hand you a 12% return in a month without some risk, right? What if the stock goes to $27 by May 20th? If this happens you have lost $2,000 on the stock but since you got $2,250 for the option, you are at about breakeven. (Your exact breakeven price is $26.75.) At this point, you can turn around and sell a June option bringing in another $2,000 or so, thus lowering your breakeven to around $25 a share. Get the idea?
Again, many, many things can happen during these months so it is not as easy as it looks, but selling at-the-money calls on stocks that stay the same or move higher can be very lucrative. Would you like to see another example next week? Write us at Info@BullMarket.com.
The Energy Corner
Notes at the Margin
By Phil Verleger
http://PKVerlegerLLC.com
Last week saw several important developments in the global economy related to the oil industry. Most who follow oil closely will focus on the results of the Doha meeting completed yesterday. [Results are not complete yet, although we know there was no agreement to cut production, so stay tuned.]
Several other events of note took place. First, on Tuesday the International Monetary Fund issued its annual world economic outlook. The report made for dismal reading. The bleak outlook was summed up succinctly in an opinion piece published in Financial Times by Olivier Blanchard. His summary is grim:
“According to the IMF, slow growth is now a fact of life after 2009.
“Productivity growth has dropped sharply, especially in Europe. It has fallen in the United States as well.
“The slowdown in advanced economies explains slowdowns in emerging markets.”
Blanchard offers the disturbing observation that “bad news about future potential growth can lead to a recession.” He explains that companies, seeing bad prospects for sales, cut investments, while consumers, confronting prospects of stagnant income, cut consumption. It is not the optimistic view one wants to read:
“If this new narrative is right, the baseline forecast is for slow but continued recovery.”
Under these circumstances, those hoping for strong increases in global oil use over the next two or three years need to go back to the drawing board. Demand will grow slowly. Price increases, if they are to occur, will require significant cuts in supply.
A more significant development was the announcement that Schlumberger was leaving Venezuela. It seems the firm has not been paid. Schlumberger’s departure is further demonstration of the nation’s destitution. Later, the country’s oil companies offered “take it or leave it” contracts to the companies producing with it. We guess most will choose to leave.
Finally, on Saturday The New York Times printed a front-page article “Saudis Tell U.S. to Back Off a bill on 9/11 Lawsuits.” The piece explained that Saudi Arabia would immediately remove [sell] its investments in the US - including a large holding of treasury bills - if the law were passed. While the chance of this is remote, this threat should be taken seriously. The economic consequences could be severe.
US Crude Oil Production Fell for the Tenth Consecutive Week
The U.S. Energy Information Administration released its “This Week in Petroleum” report on April 6th. It reported that the weekly US crude oil production fell marginally by 14,000 bpd (barrels per day) to 9 million barrels per day for the week ending April 1st, compared to the previous week. Production fell for the 10th consecutive week. It’s the lowest level since November 14, 2014. The monthly US crude oil production peaked at 9.7 million bpd in April 2015.
North Dakota crude oil production fell for the third month in a row, ticking down 0.4% in February and hitting its lowest level in 18 months. Slumping oil prices are starting to affect output in U.S. shale fields, including the prolific Bakken formation in North Dakota. Oil production in the state dropped to 1.1 million barrels a day in February, down a tick from January. The state’s output hasn’t been that low since July 2014. The slightly lower production in February follows a 2.6% drop in January and a 2.5% slide in December. The Bakken formation is one of the highest-cost sources of U.S. production. The state’s drilling rig count, a barometer of future production, stands at 26 active units, down from 32 in March, showing the fewest rigs at work in oil fields since 2005. At its peak, North Dakota had 218 rigs drilling in 2012.
The Gold Corner
In a new research report, Merrill Lynch raised price targets on many of the gold stocks that they cover. They like a number of stocks and one of them is Silver Wheaton (SLW; $17.05), what they call the largest pure precious metals streaming company in the world. Forecast 2015 estimated production is 45 million ounces of silver, and 225,000 ounces of gold. By 2019 production is anticipated to increase to approximately 55-60 million silver ounces, and 325-330,000 ounces of gold.
Silver Wheaton has 20 long-term purchase agreements in place. It has silver and gold interests all over the world so they are diversified as to country political risk. The company is currently paying a 1.2% dividend. The Merrill Lynch price target is $20 a share with the consensus target on the Street at $22.
If you wish to hear about more ideas in the gold and silver realm, let us know at Info@BullMarket.com.
Portfolio Trackers
Have you checked out our Portfolio Trackers? They are on the website at the bottom of the portfolio pages. Go to “Our Portfolios” and click on one of the portfolios and then scroll down to the bottom of the page. There you will find all the info about the stocks we have in each of our portfolios – Stocks For Success, Special Opportunities, and High Yield. All the details are right there in front of you. We love this new feature of The Bull Market Report.
BMR Companies and Commentary
Our Stocks for Success and Special Opportunities portfolios have been carefully selected to provide diversification and best in class in each sector. Last week was the beginning of 1Q16 earnings report season with Bank of America reporting earnings on target. We will be sending out our new Bull Market Report Earnings Previews providing you with a weekly update throughout earnings season on our favored stocks. We think you will find it helpful and look forward to receiving your comments.
Fitbit (FIT: $17.20, up 19% for the week) The stock is a long way from it high of $52 last August but steady progress is rewarding investors. From the February low of $12, the stock is making a strong comeback.
Last week was a leap in the right direction with the stock gaining a stellar 19%. So here is what happened: On Wednesday analysts at both Citigroup and Pacific Crest recommended the stock and raised their estimates, pointing to sales for their newest product, the Blaze, as the main reason. The Blaze competes directly with the Apple Watch but at a lower price of $200 versus $300. Blaze is on fire, selling over 1.3 million units since the late February launch.
Finally the momentum is shifting in favor of Fitbit stockholders. The Citi analyst has a price target of $30. Fitbit has scheduled the 1Q16 earnings report for May 2. The consensus is $0.02. Citi just raised their number from $0.01 to $0.04. Not terribly exciting in real numbers, but exciting enough to get the stock moving higher big time.
Twitter (TWTR: $17.60, up 6%) Many times investing contrary to conventional wisdom can be rewarding. For some time we have held this belief with regard to Twitter. The stock is well down from the 2014 high of $65. Many investors gave up when the company languished. Yet the Twitter mindset is every bit a part of today’s culture as ever; it just needs some sprucing up.
Founder Jack Dorsey’s recent return to run day-to-day operations started to turn heads. The missing ingredient is that social media, more and more, is turning to video, and Twitter needed to take action to stay relevant. The April 5, agreement with the National Football League to live stream 10 Thursday Night Football games created the big headline. What is less well known is that Twitter paid less than $1 million per game. That compares with $45 million per game at CBS. Nice going Jack.
Devon Energy Corp. (DVN, $31, up 9%) was raised to Buy from Hold and the price target was raised to $40 from $30 by one analyst. It has a consensus analyst price target of $32. Devon paid a 24 cent dividend on March 31st maintaining the dividend it paid in 2015 of 96 cents per year. In February, Devon announced a 75% reduction in the quarterly dividend on its common stock, which will bring its 2Q16 dividend to $0.06 per share. The reduced dividend will provide over $320 million in additional cash flow. Thus the company’s indicated annual dividend rate for 2016 is $0.42 per share.
Devon has $2.3 billion in cash and $10.8 billion in debt. The firm is a bit over-leveraged, but management is dedicated to getting the debt level down to more meaningful levels. We are watching this development closely. The stock is up 68% now since we added it the Special Opportunities portfolio in February with a target of $28. Because of the sharp run-up in the stock we hereby raise the Sell Price from $15 to $27, locking in our gains. The Target Price is hereby raised as well to $37.
Trader’s Corner
This section is designed to bring you some different ideas for short term traders.
Cashing in On Cannabis with Zynerba Pharmaceuticals, Inc. (ZYNE, $9.59)
(We’ve got an interesting one for you this week, but the market cap is TINY so be careful out there! Read this if you have an open mind and want to learn about a micro-cap. At $90 million, this is not a typical Bull Market Report stock. But we want to bring you all facets of the investing world, so here goes!)
If the number 4/20 doesn’t mean anything special to you, then you probably haven’t been following developments in the emerging, multi-billion dollar legal cannabis industry. Long ago cannabis users co-opted the police penal code for marijuana possession - 4/20 - and turned it into a national day of celebration every year on April 20th. With another 4/20 holiday set for mid-week, it’s a good time to identify a related trade.
Regardless of where you stand on the legality of cannabis, the drug has gained increasing acceptance in the U.S. and abroad, for both medical and recreational use. Currently, opportunities to invest in cannabis companies are almost exclusively limited to over-the-counter traded issues, as a gamut of dicey legal uncertainties continue to pose significant business challenges. There are, however two firms in the industry trading on the Nasdaq: GW Pharma (GWPH: $82 with a market cap of $1.8 billion), based in the UK, and the subject of today’s alert, Zynerba Pharmaceuticals.
Founded in 2007, Zynerba Pharmaceuticals is a specialty pharmaceutical company developing and commercializing proprietary synthetic cannabinoid therapeutics. Its products candidates include ZYN002 and ZYN001 - synthetic transdermal cannabinoid therapeutics for various types of pain that people have including refractory epilepsy, osteoarthritis, fibromyalgia, and peripheral neuropathic pain. (Transdermal means applied through the skin, like a patch.) Earlier this year, the FDA granted orphan-drug designation to ZYN002 cannabidiol (CBD) gel, for the treatment of Fragile X syndrome. In addition, Zynerba has already secured patents related to ZYN002 and ZYN001, with two in the U.S., five in Europe and two pending in Canada and Japan.
In August, 2015, ZYNE shares came to market in the IPO at $14, amid a great fanfare, in the wake of the growing trend among U.S. voters and lawmakers to usher in laws allowing the use of medical marijuana by adults, as well as legalization in Colorado, Oregon and other jurisdictions. The appeal was clear: an increasing number of studies, as well as countless anecdotal stories, documented the many beneficial effects of CBDs - one of the active ingredients in pot - for helping a wide variety of conditions.
With a tiny public float of five million shares, which gave the company an initial market cap of $48 million, the issue surged to an opening day top of $22 before closing at $16.25. By the time the buying frenzy peaked soon after the IPO’s debut, Zynerba had touched a 52-week top of $43. From there, the issue had an epic fall from grace, tumbling all the way to $5 during the early 2016 market meltdown.
We don’t currently own any ZYNE shares so there is no conflict of interest here, but we are watching closely for a potential buy of shares next week. No doubt the small float, the story behind the stock, and bull market conditions, helped put Zynerba on traders’ radar, with that $43 mark unsustainable and arguably irrational - giving Zynerba a momentary market cap of about $350 million.
When GW Pharma recently announced extremely encouraging Phase III results for its CBD-derived drug to treat epilepsy, however, ZYNE once again surged north of $20, before profiteers knocked the stock price back down to under $10. Around the same time GW Pharma shares more than doubled overnight, jumping from $35 to $80, where they currently remain. We wouldn’t invest in GW Pharma at this point, but would consider it if the stock were to drop to the $50 level, a level probably not in the cards for a while.
Our hunch is that cannabis stocks will grab the spotlight again this 4/20 week, making Zynerba worthy of monitoring for some potential momentum trading gains. Longer term, there’s the potential for significant buying catalysts as the company navigates the serpentine path to FDA approval. ZYN002 is currently being evaluated in a Phase 1 trial in healthy volunteers and patients with epilepsy, and the company expects to report results from that study in the next three months. In addition, the company’s proprietary transdermal technology, if successfully developed, would be the first product on the market providing sustained, consistent and controlled delivery of therapeutic levels of two cannabinoids: cannabidiol (CBD), and THC, the principal constituent of cannabis.
On the political front, several more states are expected to usher in the medical and recreational use of cannabis during November’s election, with California and its $2.7 billion cannabis market leading the charge. Just as significantly, later this year the Federal government will consider delisting cannabis as a Schedule 1 drug - in the same category as heroin - which has proved to be a huge barrier to the industry’s growth and acceptance.
If you haven’t traded low-float issues like Zynerba before, it’s not for the faint of heart or risk averse, and obviously there’s no guarantee that 4/20 will be a stock price catalyst. Longer term, however, Zynerba could emerge as an industry leader in the promising field of medical cannabis treatments.
By Analyst Jon Slotnik
For The Bull Market Report
MAIN STREET CAPITAL (MAIN)
A NEW ADDITION to our HIGH YIELD PORTFOLIO
Key Measures
52-Week Price Range: $24-$33
Shares Outstanding: 50 million
Market Capitalization: $1.6 billion
Dividend: $2.70 per share
Yield: 8.7%
Target Price: $40
Sell Price: $26
Price at time of publishing - $31
Fundamentals and Company Overview
Main Street Capital Corporation is a Texas-based Business Development Corporation specializing in lending to smaller middle market companies with revenues between $50 million and $500 million. Most lending is in the form of a senior debt that must be paid back in the case of a bankruptcy or company liquidation, although Main Street will also do smaller deals of subordinated debt and equity, which carry slightly higher risk.
Part of Main Street’s value proposition to investors is its ability to manage risk by identifying which companies are solvent enough and have the highest growth potential to be offered higher-risk credit, and which companies deserve any credit at all. With a two-decade history and over 200 companies in its portfolio in that time, Main Street has proven its ability to find companies that have growth potential and quality credit.
Portfolio Quality and Leverage History
The company’s portfolio is weighed towards senior debt, but Main Street has a history of using riskier equity investments to boost overall investment returns, providing extra income beyond the debt portfolio that can be used to pay special dividends (which it has done for the last four years). Here is CEO Vince Foster on the portfolio structure in February: "We continue to seek and receive significant equity participation in our lower middle market investments and as of quarter-end, we owned an average of 36% equity ownership in the 96% of these investments in which we currently have equity exposure."
The company’s portfolio has shifted towards larger companies, with 40% in lower middle market firms, 36% in middle market, and 14% private loans.
Main Street has also maintained what is a low debt-to-equity ratio by BDC standards. Having stayed around a 75% debt-to-equity ratio for three years, Main Street has been able to keep a balanced portfolio even as it has increased its Net Asset Value (NAV) significantly, and has issued new shares over the years, discussed below.
NAV Trend and Dividend Track Record
Main Street increased dividends in March 2015 and two special dividends in 2015 of $0.275 per share each. Including those dividends, Main Street’s yield is over 8.7%. Since going public four years ago, the company has consistently raised dividends while also issuing special dividends every year:

At the same time, the company has also seen steady capital gains as a result of a higher NAV thanks to the company’s high quality investments:
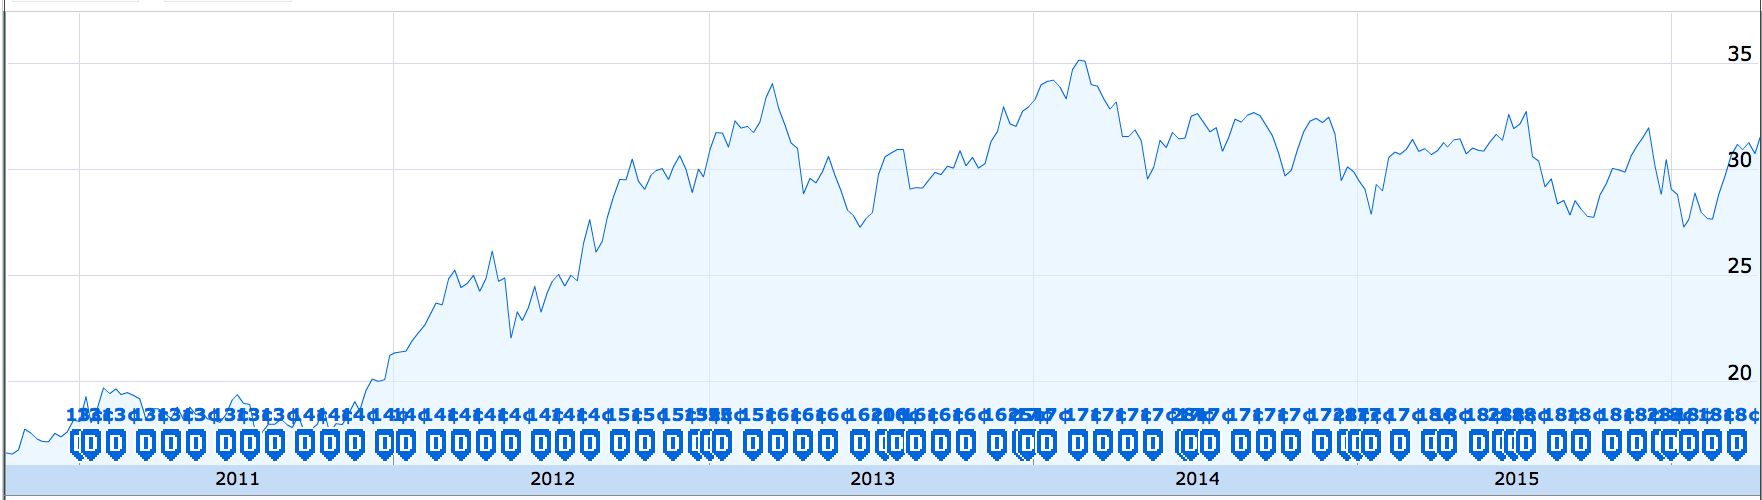
In 2015, the company’s NAV rose 4% per share on a Y/Y basis. However, it should be noted that the company’s NAV since then has fallen 2% largely as a result of the company’s energy exposure. Nonetheless, the company’s overall performance in its investments is impressive. For example, the company’s investment in energy service provider irth Solutions (that IS the correct spelling!) earned the company a $6 million return on an equity stake and an internal rate of return of 40%.
While such staggering returns aren’t always to be expected, the company is very good at earning returns of between 8% and 12% on its credit offerings to firms, while keeping costs lower than many other BDCs. Its expenses are usually about 1.5% of its assets under management - a low figure considering fees are over 2% for competitors like Prospect Capital (PSEC: $7.30). Furthermore Main Street has significantly outperformed them in both dividends, capital gains, and NAV growth.
Risks and Considerations
The biggest risk with Main Street is its exposure to energy. In the past, it has invested nearly 10% of assets in energy and energy-related companies, but has recently shied away from the industry by recognizing investor concerns about taking on too much exposure to oil prices, as CEO Vince Foster said during the third quarter earnings call: "We probably would not be looking at new service type, energy service type investments. I don't think that our investors, our lenders and our [bankers] particularly don’t want to see us having much more in a way of energy exposure, particular on the service side."
Another consideration is that Main Street is trading above net asset value, when some BDCs are trading at significant discounts. Prospect’s current discount of around 30% makes it appear to be a bargain, while Main Street’s 45% premium to NAV looks like a foolish overpayment.
The easy counterargument can be made with one chart:
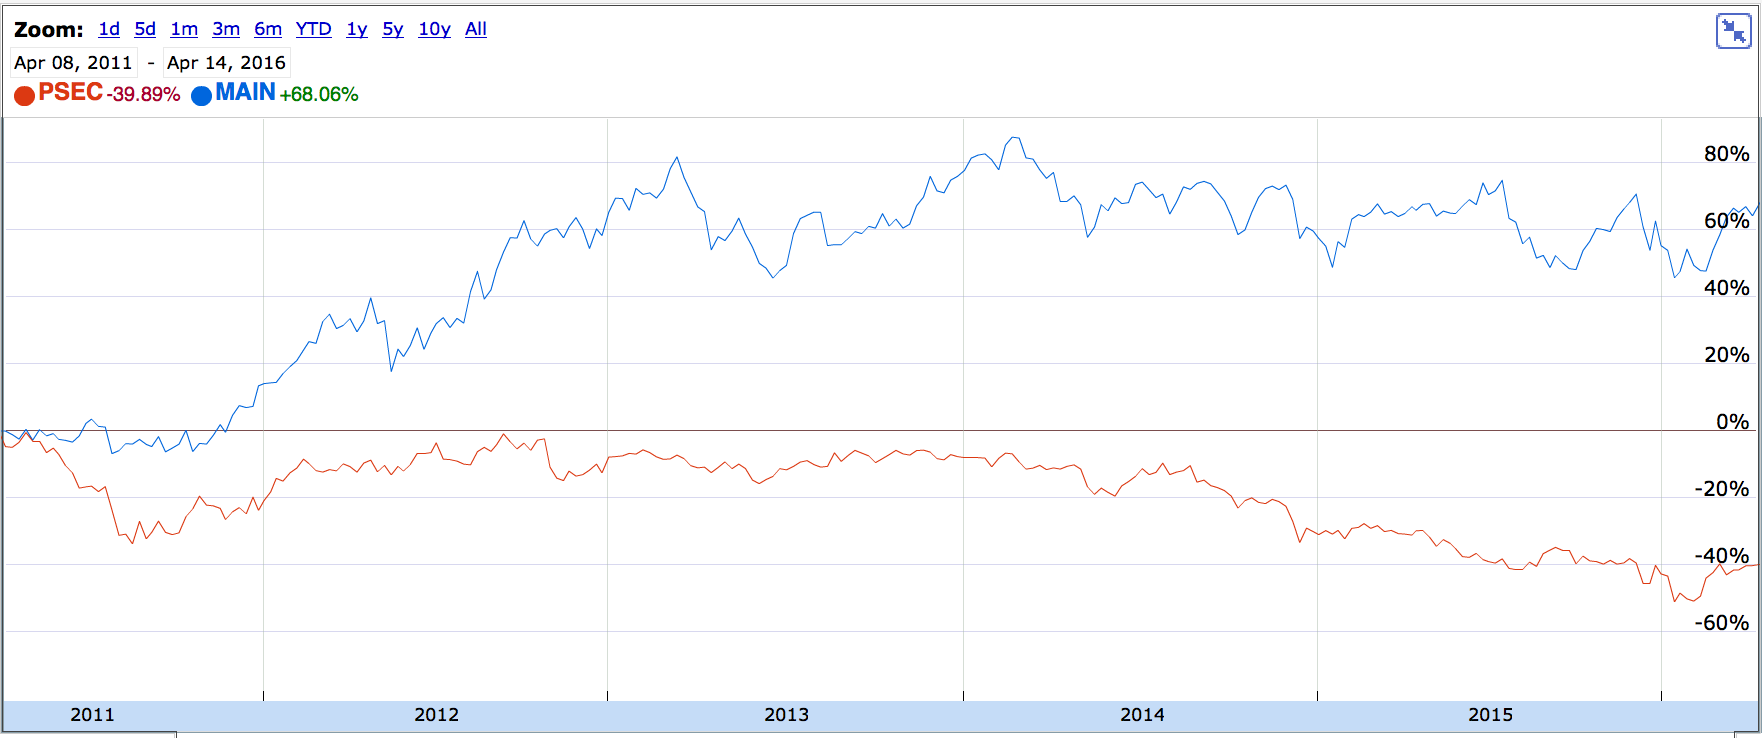
A more cogent response would be to bear in mind that the market has priced in expected mark-to-market discounting of Prospect Capital’s portfolio, which contains several leveraged loan derivatives that analysts have argued are overvalued. While Prospect has already discounted some of these, causing its NAV to fall, more discounting is expected. Main Street, however, has no such derivatives in its portfolio.
BMR Take:
All considered, Main Street can be considered one of the lowest risk 8% yielders on the market. Even forgetting the special dividends, a 6.9% dividend growth stock is incredibly good, and the risks from its energy exposure and premium to NAV look to be fairly inconsiderate relative to the company’s track record of high returns by investing smartly in growth-positioned firms.
Finding an entry point is difficult, however; Main Street is up 14% from February’s low point and is 5% below its 52-week high. The BDC sector has substantially outperformed just about everything else as the market realizes just how oversold the sector was earlier this year, making timing purchases tricky. If a market correction comes, Main Street is a definite buy at any point below $30, but buying now will still secure a solid income stream for many years to come.
Good Investing,
Todd Shaver
Editor in Chief