by Todd Shaver | Mar 6, 2016 | Weekly Newsletter 7pm Sunday
That Was The Week That Was
March 6, 2016
Can It Get Any Better Than This?
Can you feel it in your bones? It is the feeling that when the stock market is right, the world is right. That feeling puts more pep in every step and welcomes thoughts of living on this cloud forever.
There are real reasons for elation. We just finished the best 3-week stock market rally in five years. There has been broadscale participation. Energy stocks have been a strong, from their lows. The once doggie Financial sector has started to wag its cute little tail. And for all the talk of deflation and the prospects of a looming recession, companies making basic materials that are highly sensitive to economic activity have quietly been churning out some big stock price gains.
Here is how the major indices fared for the week.
| Key Market Measures (Friday close) |
|
|
|
|
| S&P 500: |
2000 |
2.7% |
|
| NASDAQ: |
4717 |
2.7% |
|
| Crude Oil: |
$36 |
9.5% |
|
| Gold: |
1,260 |
3.3% |
|
What a difference a few days and a few dollars in the price of crude can make. Only last month U.S. equity markets appeared to be gyrating perilously lower, already in correction country and threatening to head further south with $20 barrels of oil portending a global recession. Now we’re back to $36 oil and rising, along with stock prices which officially exited correction mode last week.
To put things in larger perspective, February turned out to be not that bad of a month for stocks. The Dow actually rose 0.3% during the extremely volatile period, while the S&P 500 shed 0.4%. The Nasdaq was a relative laggard, dipping 1.2%. It wasn’t long ago that market pundits were predicting long-term doom and gloom for crude oil, with the drumbeat of an imminent global recession steadily growing louder.
Things weren’t looking up Monday, however, as even strengthening oil prices couldn’t keep profit-takers at bay. The Dow suffered a triple digit loss, trading down to the 16,500 level, with the S&P 500 and Nasdaq moving lower in lockstep - finishing at 1,932 and 4,558, respectively. Despite the mildly bearish move, the key news of the day, that the Saudis were pledging to help reduce oil market volatility, was setting the stage for a powerful short-covering rally in the sector.
As it turns out, the negative sentiment didn’t last long, as a good old-fashioned bull market rally took hold Tuesday, fueled by a spate of positive news. On the macroeconomic front, GDP was revised significantly higher to 3.7% from the 2.3% rate reported last month, while oil prices continued their gradual ascent. In addition, jobless claims fell more than expected, and both manufacturing data and auto sales showed unexpected strength. Finally, the volatility index (VIX) dropped by over 10% to 18.4 - its lowest level since the end of 2015.
After surging more than 350 points Tuesday, the good times kept rolling the rest of the week, with the Dow, Nasdaq and S&P 500 running the table with uniformly positive closes. It was an impressive showing that saw Blue Chips recapture the 17,000 level by the end of the week, while the S&P 500 stopped a millimeter short of finishing above the technically significant 2,000 pivot. The Nasdaq ended with a final print of 4,717.
Key Economic Reports: Which Way To Nowhere
There was loads of data on the economy out this week. We are talking about some really juicy stuff on labor, wages, unemployment, and more. The Fed’s “data driven” interest rate policy has its eyes on these types of clues to hatch their devious schemes. This week’s numbers should have revealed a lot. Thursday and Friday produced the heaviest doses.
Unfortunately, as much as we were all looking for leadership, there was little to be found. Thursday was the busiest day this week for news. It turned out to be a complete mixed bag. Weekly jobless claims at 278,000 were higher than expected, factory orders were up 1.6% but much less than the 2.4% consensus forecast. Unit labor costs were up 3.3% but less than the 3.6% expected. It goes on but you get the idea. There is no clear direction from any of this data.
The one big surprise came with the Non-farm Payroll numbers on Friday. The economy added 272,000 jobs in February rather than the 195,000 that experts had been looking for. The always-deceptive unemployment rate remained at a low and stable 4.9%. Hooray for the working people. Not quite so fast: At the same time, average hourly earnings fell 0.1% compared to a 0.2% gain forecast.
The Fed: To Hike Rates or Just Leave Town and Go For a Hike
The Fed has run out of weapons to stimulate the economy any further. In their efforts to walk a tightrope between deflation and inflation, they have chosen thus far to raise rates. We all remember the last rate hike in December and how that resulted in the January debacle. Now just as stock prices are coming close to recovering January losses, the indicators of a second rate hike are rising also.
For all the Fedspeak about being data driven and the conflicting economic data, interest rate futures have their own opinion, and we all know the market is always right. The direction is up. The pundits and the market itself has placed a 30% probability on a hike by June and a 60% chance of at least one before December.
One way to gauge higher interest rate risk - just look at the moribund Financial sector. Higher interest rates usually mean higher rate spreads, which makes banks happy and helps investment companies earn fees. This week was a good week for most all our Financial favorites:
BMR Financial Stocks Price Change
Week of March 4, 2016
| COMPANY |
SYMBOL |
PRICE |
CHG. |
| Financial Sector |
|
|
1.6% |
| ANNALY CAPITAL |
NLY |
$10.28 |
Unch. |
| BANK of AMERICA |
BAC |
$13.50 |
6% |
| GOLDMAN SACHS |
GS |
$157 |
5% |
| BLACKSTONE GROUP |
BX |
$29 |
14% |
|
|
|
|
There is one very obvious conclusion from this data. Each of these companies stands to benefit from higher interest rates, with Bank of America and Goldman Sachs the most likely. Blackstone revenues are both interest rate- and stock market-related which explains their exceptional performance this week. Annaly is a mortgage real estate investment trust. Their portfolio of interest rate hedges and rate swaps will improve if and when spreads widen. (But note that Annaly will be fine in a stable to lower interest rate environment too, as we have stated in our Research Report on our website, and written about many times.)
Time For Early Spring House Cleaning
It is time to be cautious. We have just completed a wonderful three-week period. We are almost back to even on the year. Another interest rate hike may or may not happen this year but the rising specter is a cloud that demands a strategy. Here is our suggestion: It’s time for an early spring house cleaning.
This is a rare opportunity for us all to take an objective look at our portfolios; to identify which have been your winners; to separate them from the laggards. If your list of lagging stocks in 2015 has also underperformed since the January lows, it time to say good-bye and put the cash on the sideline. This way, if there is another interest rate hike and the market tumbles, you will have buying power to go bargain hunting. Chances are the stocks that you sell will continue to underperform. If you clean house, they won’t be dragging you down as well. This is not a trading strategy for stock flippers. It is a strategy to thin your portfolio and have the cash ready to be allocated for those bargains that will inevitably present themselves.
Oil Prices: Is This The Bottom or A Big Short Squeeze?
Energy stocks offered the big surprise this week with Devon Energy (DVN, $23, up 15% this week) and Kinder Morgan (KMI, $18.52, up 4%) having a good week. These are two of our favorites in the Energy sector and are part of the Oil & Gas Drilling Sector. Overall, the Energy sector just happened to be the top-performing group of the week. To top off the week, crude rose almost 10% to $36 a barrel.
Is it possible we have seen the bottom in oil pricing? Nobody knows and everybody guesses on this question. Here is a thought. Whenever a commodity or market bottoms it almost never takes place when there is anything but total doubt and confusion. That is certainly the case with oil. The glut of inventory remains and all the global issues and conflicts that created the glut haven't changed. So uncertainty will remain for some time.
What we do know is that there is still a line of thinking that crude will fall to $20 per barrel. These folks have made Energy one of the most heavily shorted groups in the market. Short selling is greed turned upside down. The lower prices fall the more these guys sell short. Lower prices feed their greed. BUT, there are several reasons to frighten short sellers into covering, and we know that a market bottom can be created without the appearance of any good fundamental news. What we have been witnessing for the past few weeks is the short sellers trying to cover. When this happens, price spikes can be violent. This week the shorts got squeezed pretty hard.
Our 20 Stocks For Success
We must not overlook the action in the two Elon Musk stocks, Solar City (SCTY: $22, up 19% this week) and Tesla Motors (TSLA: $201, up 5%). These are two favorites of short sellers and it appears that greed is still running high. Both stocks took a severe pounding during the January decline. But this did not dissuade short sellers from selling even more borrowed stock in hopes of even further declines. In the case of Tesla the short position since the first of this year has increased from 23% to 28% of the outstanding shares. This is huge. We understand that brokers have doubled interest rates on borrowed Tesla shares. Short covering of any portion of these positions will drive both of these stocks far higher. And you remember that if a stock is heavily shorted, that this is a bullish position, right? Why? Because the only thing a short can do to liquidate his position is to buy it back. Bullish.
GoPro (GPRO, $13.36, up 12%) GoPro is the subject of a News Flash we put out Friday. The stock has been strong after taking it on the chin, down from $65 last July. We heard a thud when the stock hit $11 in January. It has since rebounded a bit gaining 25% since those dark days. It hasn’t hurt that founder Nick Woodman appeared before the annual Morgan Stanley Tech Conference on Wednesday. What seemed to help most, however, is finding a solution to GoPro’s cranky video editing software. The solution will hopefully be found through the acquisition of two companies: Replay and Splice. As you might guess, both specialize in video editing. Investors welcomed the news. Keep going Nick, there is still more work to be done.
Splunk (SPLK, $46, up 11%) You may have noticed we added a new and rather weirdly named company to our Special Opportunities Portfolio. Their game started with Cyber Security. This is all part of the craze over “Big Data” and what Splunk calls Operational Intelligence. The company is growing at a staggering 50% average annual rate. What seems to be happening is the customers that try Splunk’s Operational Intelligence software for their security needs find many new “Unintended Uses” and buy lots more. That also means more demand for services and maintenance.
The stock has fallen from its $75 high last summer. More recently Splunk investors fell into guilt by association with another enterprise company Tableau Software. The stock fell to nearly $30 before the market finally realized these are two very different animals. This is a company whose business we really like. The stock has some big upside.
A Light Week Coming Up
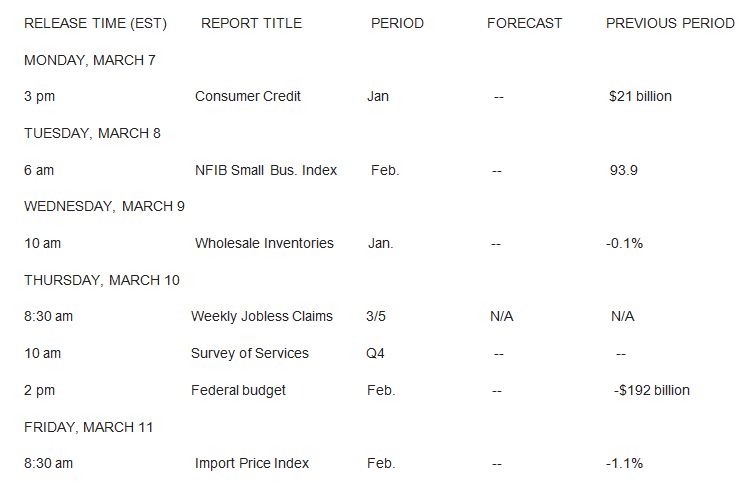
With much of the consumer, inflation and employment numbers out of the way, it promises to be a quiet week. Unless something really startling on Consumer Credit comes out on Monday, or Thursday’s Federal Budget deficit pops us with some unexpected numbers, all should be quiet this week from Washington.
Economic Reports Due:
Week of March 7, 2016
BMR High Yield Corner
We are super excited to tell you that we started our new portfolio this week and published our first stock pick, AllianzGI’s Equity & Convertible Income Fund (NIE, $18.01, up 3%). It has a funny name but great pedigree, paying 7.7% with a market cap of $500 million.
The company just declared the quarterly distribution of 38 cents payable on March 24 to shareholders of record on March 14 with an ex-dividend date of March 10. It is anticipated that the Fund’s next quarterly distribution will be declared on or about June 3 and be payable on June 24. If you need to contact the firm you can do so here: Shareholders: 800.254.5197; Media Relations: 212.739.3501.
High yield ended the week strong, indicating that a bottoming of the income investing world may already be history.
One of the best performing sectors was Energy Master Limited Partnerships (MLPs), as demonstrated by the surge in the Alerian MLP ETF (AMLP, $10.69, 11.8% dividend), which closed the week up 13%. Thanks to oil, which saw around a 9% gain for the week, investors afraid of energy stocks took a second look at the MLP world. The gains that those stocks enjoyed over the past week will depend on further improvement in the price of oil, rendering a bet on MLPs more a bet on commodity prices than a bet on the high yield income world.
Fundamentals have become more important for business development corporations (BDCs), and this week saw the conclusion of the earnings season for most of the sector. Results remained strong, as TCP Capital Corporation (TCPC, $14.00, 9.5% dividend) and New Mountain Finance Corporation (NMFC, $12.69, 9.8% dividend) both reported some positive results, with TCP Capital showing an increase in net investment income (NII). Goldman Sachs’s BDC (GSBD, $19.05, 9.1% dividend) also reported a strong 9% increase in NII.
In the high yield bond market, junk bonds failed to live up to their name. With a weekly gain of about 2% for the SPDR Barclays High Yield Bond ETF (JNK, $34), high yield bonds found plenty of buyers even as fears that the junk bond market would suffer a higher lack of liquidity as investors shied away from risks as we move forward in 2016. Interest rates on junk bond yields fell in the week form over 9.1% to 8.7% (with prices moving higher of course.) This is a trend that has accelerated in the last few weeks, after debt yields in this market spiked at over 10%.
This significance of this demands attention. Junk bond yields are a function of market demand and default expectations. When bond yields rise, it is because the market expects more defaults and thus they want a higher rate of return to be compensated for the risk of buying defaulting debt. Junk bond yields have risen considerably throughout 2015 and early 2016, with lower energy prices expected to cause higher company default rates. According to Moody’s, default rates are expected to continue to rise.
The fact that junk bond yields spiked earlier this year and have since fallen means that the market has finally accepted that there will be more corporate defaults - and they’re okay with that. It won’t necessarily mean a tragedy, it won’t mean an economic crisis, and it won’t mean bond funds will go bust. As a result, these junk bonds have been worth buying to lock in their attractive yields, and that demand has caused prices to rise and bond yields to fall. (With bonds, yields and prices are inversely connected to one another, as you know.)
The best time to buy high yield bonds may be behind us, but that doesn’t mean good times don’t remain ahead. Bond markets are slow and deliberate, so buying pressure is likely to continue for some time. Meanwhile, those that have already bought are getting an income stream of over 10% of their investment.
Stocks We’re Looking At
Synchrony Financial (SYF, $29, $24 billion market cap) is the legacy credit card business spun out of General Electric Capital as part of a restructuring in 2014. They have been in business over 80 years. The company is the largest store-brand credit card issuer in the United States, and its credit card partners include the retail giants Walmart, T.J. Maxx, Rite-Aid and Discount Tire. Synchrony is 4% of the Soros Fund Management's $5.4 billion portfolio. Soros believes that credit card rates -- and the profits associated with the spread between Synchrony Financial's borrowing and lending rates -- are heading higher. Last year, Synchrony Financial reported net interest income of $12 billion, up 7%, and net profit of $2.1 billion, up 5%, so an improvement in spreads could move the needle nicely.
iShares Mortgage Real Estate Capped ETF (REM, $9.56, 12.3% dividend) moved higher this week by 26 cents. Doesn’t sound like much, but that’s a 3% move. We’ll take it. This $750 million Exchange Traded Fund (ETF) “seeks to track the investment results of the FTSE NAREIT All Mortgage Capped Index composed of U.S. Real Estate Investment Trusts that hold U.S. residential and commercial mortgages. The fund generally will invest at least 90% of its assets in the component securities of the underlying index and may invest up to 10% of its assets in certain futures, options and swap contracts, cash and cash equivalents.”* We like this one. We might just add this to our High Yield Portfolio! Stay tuned.
*From their website
Under Armour (UA, $84, flat for the week) We didn’t mention this before but with revenues at $4 billion now, the CEO’s goal is $10 billion in revenue by 2020! Wow. Big goal. We like big goals, and we think the CEO can do it. The Maryland-based company isn't focusing on one particular area. Basketball, connected technology, golf, and many other segments all need to grow for this to happen. We’re watching, waiting and holding. Buying? You bet.
The Apple Corner
Apple (AAPL: $103, up 6% for the week) Apple was reiterated as Buy with a $130 price objective at Bank of America Merrill Lynch. They said that Apple devices will play an important role in personal health care. They cited Apple Watch and iPhone accessories as sensory input devices, and the iPhone Health App, alongside of new Apple products like HealthKit, ResearchKit and iPadPro. We agree.
Apple is now looking to hold their big spring event on Monday, March 21. They are expected to make several product announcements at the event, including the new 4-inch "iPhone SE," a new 9.7-inch iPad, and a few Apple Watch-related announcements. Business as usual we say.
Our thoughts on the Apple vs. FBI story? This will take a long time to play out. In the meantime it is good PR for Apple. Story over.
Why do we cover Apple every week? Because as we said in our little video on the website: “There are two kinds of people in the world: Those that own Apple stock and those that don’t. Those that own Apple want to know if they should sell. Those that don’t own Apple want to know if it is too late to buy.” This is true of ALL 7.4 billion people on the planet! (Well, maybe not ALL.) Plus did we mention that Apple is the largest company by market capitalization in the world? Sure is - $570 billion. That’s why we talk about it every week.
The big debate is whether Apple is a growth stock or a value stock. Lots of cynics out there think the growth story at Apple is over. We are not in that camp. No company has as much cash per share as Apple has. (39%) No company has ever even come close. Google has a lot of cash, $72 billion, but only $105 per share, or just 15% per share. Did we mention Apple has 39% per share in cash. OK. Big deal you say. Well, we say yes, big deal. You get the whole of Apple for just $63 ($103-$40) per share which values Apple without their cash of $350 billion. All their employees; all their patents; all their products; all their stores. Well, we could go on and on.
We are buying the stock and looking for a new all-time high in the stock if the market continues to be strong. All time high? $134 in April, 2015.
The Options Corner
Last week we said this:
Oh, we mentioned last week that Netflix ($NFLX, $95) would be a good candidate for the deep-in-the-money covered call strategy since the shares are fairly high-priced. Briefly, if you thought Netflix could move up to the $105 level in the next few months one could buy the January 80 LEAP (expiring in January 2017) for $26.50 (connoting a breakeven of $106.50), and then immediately sell a June $105 call for $7.30, moving your cost down to $19.20, and the breakeven down to $99.20. Then in June, you could turnaround and sell a September call and bring in another $7 or so, reducing you cost to $12 and your breakeven down to $92. Love this one.
Let's review: Where is Netflix now? $102, up $7 for the week. We are liking this trade so far. Looking at real prices, the $80 LEAP (expiring in January, 2017) is $31. The June 105 call is at $9.35, for a net of $21.65. If you review the numbers from last week above, we paid $19.20, so we are up 13% on the position. Even better is that we are much further ahead of our breakeven price of $99.20. When the trade was put on, the breakeven was higher than the stock. Now the breakeven is lower. All good. From here we would love to see the stock rise slow down a little. If the stock stays here or goes a little higher to $105, that would be perfect. But of course, things are never perfect, so we will watch and wait. As we wait, the premium on the $105 call will melt away (and could melt all the way to zero if the stock stays under $105) and that’s a good thing (since we are short the 105 call.)
Gold and the Golden Boy
By John Slotnick, a financial writer and stock trader for 15 years.
Special to The Bull Market Report
If you’ve ever tried to trade precious metals equities, then you’re probably all-too-familiar with their mercurial and highly volatile price fluctuations. The metaphor that comes to mind is Johnny Manziel, the soon-to-be former Cleveland Browns quarterback who showed flashes of greatness in his college days, but has had a volatile and erratic pro career, with the Golden Boy’s great promise destined to fade into oblivion.
During my two decades of trading stocks, I’ve occasionally dabbled in gold issues. It has almost always come at a time of extreme market stress, when pundits and gold-bugs tout an investment in the yellow ore as a “defensive play.” Ultimately, the success and failure of those trades was joined at the hip with the trajectory of the open market price of gold, which sometimes, but not always, goes higher when equity markets are stressed. What I discovered the hard way was that gold rallies usually have a short shelf life, kind of like Johnny Football’s few good pro games.
Earlier this year, with U.S. equity markets quickly and surprisingly correcting to the downside, gold prices jumped over 10%. The first and most powerful move higher catapulted gold’s price through resistance at $1100, setting a course due north, all the way through $1200 per ounce - eventually topping out in a momentum-fueled run to around $1260. By standard stock market logic, the move made perfect sense, as U.S. stocks were plummeting, and cratering crude appeared to foreshadow a larger global economic slowdown.
Here’s what’s surprising: Despite the fact that equity markets have recently fought their way back from correction-ville, gold prices remain buoyant, at one point challenging the $1280 mark on Friday, their highest level in years. Last month gold analysts generally agreed that if gold could penetrate and hold above the $1200 level, it was a technical signal that the rally would have legs. So far that level has held.
The most interesting question arising from these developments is why? Why is gold strong at the same time U.S. stocks are moving higher and crude oil is showing a modest price bounce as well? One of the most common ideas is that low interest rates make gold attractive, especially compared to bonds and other fixed-income investments. With the whole world watching and waiting for higher interest rates, rates in the past two months have sunk. In addition, strength in the U.S. dollar has always had an inverse correlation with the price of gold, and last week the dollar weakened considerably, supporting continued buying in the precious metals pits.
There’s also the plain fact of technical and chart-based indicators possibly pointing to a move higher. According to a Forbes article from last week, a close above technical resistance at the February high of $1,264 would be a bullish sign portending an ongoing breakout, with current technical support residing at the $1,220 level. So think of $1,220 as yet another video of Johnny Manziel swilling champagne in a child’s disguise at an inner-city nightclub, with $1,264 a signpost that the kid may be able to rebuild his unpredictable and often unfathomable reputation.
Stocks We Love
Apple (AAPL, $103, up 7%) – We love Apple.
Netflix (NFLX, $102, up 7% for the week) – We love movies. We keep watching movies. Last month Netflix announced that it has expanded to an additional 130 countries around the globe, solidifying its unique status as a truly global company. With 75 million subscribers and growing we see no upwards constraints on growth. $9 or $10 a month for unlimited movies is a bargain. And when they need another $900 million in profits to the bottom line, they raise prices $1 a month. Huge.
CBRE (CBG, $28, up 6% last week) – Wait until you see this stock on Monday! Big news came out Friday. We LOVE this company. Oh – that’s right – It’s in the title of this section! Why? Because they have the smartest real estate professionals in the world bringing brainpower to their clients. And the clients are willing pay millions of dollars to CBRE in order to produce multiple millions of dollars in savings. The company is worth $9 billion. It should be worth $15 billion.
Bank of America (BAC, $13.54, up 7% last week) – We’ve been beating the drums on this one. $140 billion market cap. Super smart management (Brian T. Moynihan, only 56 years old). A great name (with “America” in it!). A branch on every corner, and on every computer and mobile device in the world. A Wealth Management division. Founded in 1874. Too big to fail! And interest rates steady but which can only go higher as the US Government continues to print money. The drumroll continues.
Goldman Sachs (GS, $157, up 4% last week) - $70 billion market cap. Super smart people – just try to get a job there – all the top college grads want to work at Goldman. They take only the smartest. $171 book value. Really? You can get this company for less than it’s worth? And, the best thing of all – they know how to make money in good times and bad.
Blackstone Group (BX, $29, up 13% last week) And speaking of financial firms, this company is the biggest and best of them all. (This is not an exaggeration: They have $335 billion in private equity holdings, real estate, credit and hedge funds.) They manage more assets than any other firm in the world. They know how to RAISE money for new deals; they know how to buy assets inexpensively; and they know how to sell assets for way more than they paid for them. Simple; elegant. Plus they have a CEO, worth $9 billion, with most of his money tied up in the company who thinks the stock is GROSSLY UNDERVALUED and is doing everything in his power to change that. We agree and want to be part of the ride higher.
Good Investing!
Todd Shaver, Editor
The Bull Market Report
Info@BullMarket.com
Customer Service: 800.687.3401
LEGAL TERMS/DISCLAIMER The Bull Market Report editorial staff are not registered investment advisers, broker/dealers, or research analysts. Readers are advised that the commentary and reports on The Bull Market Report website (the “Website”) and in its newsletters are issued solely for informational purposes and should not to be construed as an offer to sell or the solicitation of an offer to buy any security. The opinions and analyses included herein are based on sources believed to be reliable and written in good faith, but no representation or warranty, expressed or implied is made as to their accuracy, completeness or correctness.
YOU SHOULD VERIFY ALL CLAIMS AND DO YOUR OWN RESEARCH BEFORE INVESTING IN ANY SECURITY MENTIONED IN THE BULL MARKET REPORT, OR THAT IS DISCUSSED ON THE BULLMARKET.COM WEBSITE. INVESTING IN SECURITIES IS SPECULATIVE AND CARRIES A HIGH DEGREE OF RISK. YOU MAY LOSE PART OR ALL OF YOUR PRINCIPAL INVESTMENT.
Readers are urged to consult with their own independent financial advisers with respect to any investment. All information contained in this report should be independently verified with the companies mentioned. Neither The Bull Market Report, nor Todd Shaver, nor their officers, directors, partners, members, contributors or employees/consultants accept any liability whatsoever for any direct or consequential loss arising from any use of information on this website or any use of information in its newsletters.
Todd Shaver and his partners, contributors or employees and consultants may on occasion hold positions in the securities mentioned on the Website. These positions may change at any time. Please note that neither Todd Shaver nor any of the Website editorial staff receives compensation of any kind for mentioning a company on the Website. We are neither attorneys nor accountants and no portion of the Website content should be interpreted as legal, accounting or tax advice.
Past performance may not be indicative of future results. Therefore, no prospective or existing subscriber should assume that future performance of any specific investment or investment strategy, including the investments or investment strategies made reference to directly or indirectly in the Website, or indirectly via a link to an unaffiliated third party website, will be profitable or equal any historical performance levels.
Please remember that different types of investments involve varying degrees of risk, and there can be no assurance that any specific investment will be suitable for a prospective or existing subscriber’s investment portfolio. Historical performance results for investment indices or categories generally do not reflect the deduction of transaction or custodial charges, the deduction of an investment management fee, nor the impact of taxes, the occurrence of which would have the effect of decreasing historical performance results.
USE OF THIS SITE SIGNIFIES YOUR AGREEMENT TO OUR TERMS OF USE AGREEMENT
