May 15, 2016
by Todd Shaver | May 15, 2016 | Weekly Newsletter 7pm Sunday
THE BULL MARKET REPORT
MAY 16, 2016
Corporate CEOs Are Lowering Expectations
After the third week of lower stock prices, any froth left over from the February rally has evaporated. To paraphrase Shakespeare, Friday closed not with a whimper but with a bang. Unfortunately, lower. Nasdaq is leading the downside move but all major markets experienced a bit of sober thinking. Don’t let this be a distraction. The adjustment is creating opportunities for us.
Are investors selling in May and going away or just confused by May and hiding away? There is a chasm between economists who, after taking a look at poor 1Q16 GDP numbers, believe there will be a step up in the pace of growth from here. The very corporate executives whose job it is to deliver results disagree. The companies lowering guidance for 2016 is substantial. Last week the consumer sector got a full dose of lowered expectations and for these companies, things got ugly.
| Key Market Measures (Friday Close) |
|
|
|
|
|
| Dow Jones |
17,535 |
-206 |
-1.2% |
| S&P 500: |
2,047 |
-10 |
-0.5% |
| Nasdaq |
4,718 |
-18 |
-0.4% |
| Crude Oil: |
$46 |
+$1 |
+2.2% |
| Gold: |
$1,290 |
-$15 |
-1.2% |
What Is Going On with Consumers?
Stocks had a rough week. Just when you thought the risk of earnings season was over, along comes Disney and Macy’s. Both of these consumer bellwethers did the unthinkable. Macy’ s reported disappointing numbers, falling short on revenues and earnings. Disney (DIS: $101) was down 5% for the week while Macy’s (M: $31) was even less fortunate, down 17%. For Disney, it was soft theme park attendance while Macy’s is struggling with lower store traffic.
Then came Thursday’s news after the market closed. Nordstrom (JWN: $39, down 18% for the week – all prices are for the week), Kohl’s (KSS: $36, down 14%) and JC Penny (JCP: $7.58, down 8%) each reported a big miss in earnings. Worse yet, each lowered guidance. Wham, suddenly the woodshed got really crowded. Double-digit stock declines followed in many cases.
Pieces of the mosaic began to fit together with the Wednesday surprise jump of 24,000 in Jobless Claims. Bonds rallied reducing yields to their lowest levels since February. The odds of an interest rate hike anytime soon further diminished.
So, the conclusion is obvious: The consumer is in trouble and recession is ahead. There is no other possible explanation. Wrong. Friday showed April retail sales jumped an incredible 1.3% led by surprisingly strong Autos, while the Consumer Sentiment Index took its biggest jump in years going from 89.0 to 95.8. Forecasting the future is not as easy as it used to be.
Are these signs of a continued trend toward online shopping or is everybody shifting to discount stores? Nobody we spoke with has the answer. This is why our favorite retailer is Home Depot (HD: $133, down 2%). Online commerce is a blessing, not a threat. And when you are looking to buy a 2x4, it is hard to find a lower price for lumber anywhere. Note: We just got back from a visit to Home Depot as we travel the country this month, now in New Hampshire. Let us tell you – it was packed. A very good sign for Home Depot and for the economy.
Tech: The Secret of the Market
For the third week, the Nasdaq has lagged the overall market and is down 6% year to date. That is a whole lot worse than either the Dow Jones or S&P 500. Last week we talked about a market correction, pointing out the deteriorating of the Nasdaq as the traditional leading indicator. There is a reason for this and it comes from Tech stocks. The index is market weighted so the higher the market cap, the more the influence in the level of the Nasdaq Composite Index. The 10 largest companies include the best-known names in technology. This group represents 50% of the index, including Amazon (AMZN: $710, up 5%), Apple (AAPL: $91, down 2%), Alphabet (GOOG: $711, unch.) and Facebook (FB: $120, unch.). All 10 represent a staggering $2 trillion of stockholder value.
As Technology goes, so goes the market and with some of the biggest names like Apple and Netflix (NFLX: $88, down 3%) under pressure, others could follow. There are some great opportunities being created. Let’s take a look at a few.
BMR Company Commentary
Apple. This week Tim Cook announced Apple will invest $1 billion in Chinese ride-sharing company Didi Chuxing. The Didi investment is small change as Apple has $220 billion in cash and over $230 billion in revenues, but will give analysts plenty to talk about. Didi is the Uber of China. Analysts speculate the move could boost Apple’s plans for autonomous driving vehicles as well as a ready-made customer base for Apple Pay. We agree, both options represent huge markets. Apple needs a lot more big, creative ideas like this.
Meanwhile the stock is selling at its lowest valuation in years: 10 times earnings and you get a 2.5% dividend while waiting for the next wave of technology to drive the stock to new highs. This is outstanding value we haven’t seen in years.
United Parcel Service (UPS: $101, down 1%) UPS is an obvious beneficiary of the transition in retail from bricks and mortar to home delivery. Last week, one of CNBC’s retail experts predicted online commerce would rise from the present 7% share to 50% over time. Translated into English, we are talking about several trillion dollars of incremental business. This is huge. The stock sells for a bit less than the overall stock market multiple (18 versus 22) and you get a 3% dividend yield. We see no upper limit to the growth of this firm, in revenues nor stock price.
First Solar (FSLR: $49, down 6%) Solar stocks have had a rough ride this year. Price competition and the drop in competing energy costs have not helped. But we see light at the end of the tunnel: and it is sunlight! What we like most about First Solar is their superior production techniques, followed by the volume produced by their Systems Operations division. These are the folks that design, engineer and install large systems for public utilities, corporations and the major energy users in technology. The stock is finally getting the respect it deserves. In the past month, three Wall Street firms have initiated coverage; two with buy recommendations. You can add our buy recommendation to that list.
Twitter (TWTR: $14.10, down 1%) It seems true, nobody loves you when you are down and out. Well Twitter may be down, but far from out. Founder Jack Dorsey’s return has hardly had time to produce much beyond the Thursday Night Football deal with the NFL. Don’t forget the value of over 300 million Twitter users. And with the stock selling at less than half its 2013 IPO, at current levels the company is an attractive takeover. Some might say a bargain.
Barrick Gold (ABX: $18.41, unch.) Barrick has been a monster since the February 9th addition to our list of favorite stocks - up 64% in a little over three months. It’s not over by any means. In a time of negative interest rates in key global economies, gold is a logical alternative. Unlike the bullion, with the shares of Barrick Gold there is no added cost for storage. Lately, earnings haven’t been much to write home about but that hasn’t deterred Wall Street analysts who have been upgrading the stock, now with a $25 price target. Yea team, go for the (Barrick) Gold!
Annaly Capital Mortgage (NLY: $11.05, up 2%) We had a letter to us on our website from Jerald Wilks:
Is it too late to buy this stock since it is at its 52 week high and nearing your target price?
Hi Jerald - We have loved Annaly for almost 20 years, since we started The Bull Market Report in 1998. The stock has gone up and down during this time for various reasons. They have survived bull markets and bear, high interest rate environments and low, and the one thing that has been constant is that they have paid a high dividend year in and year out. The company was formed in the late 90s and early on paid a constant dividend each quarter. Years ago they switched to a variable interest rate which is much smarter because obviously earnings vary month to month.
Wall Street always gets worried about Annaly when there is a threat of higher interest rates (like now and for the past 10 years!) but what most don’t realize is that the company actually thrives during higher interest rates environments. The Street just doesn't get it. The company’s portfolio of mortgages is laddered so if rates go up, the money they get back from maturing issues is reinvested at higher rates. Simple. Elegant.
More Commentary on Annaly: To review, the company makes money by leveraging their equity 4 to 5 times and investing in US Government backed securities, like Freddie Mac and Fannie Mae. The spread on their borrowings is about 3%, multiplied by the 4-5 times leverage. Thus they are able to pay their executives ridiculous amounts ($25 million+ - which makes us CRAZY at The Bull Market Report – but if you can get over this and just look at the dividend, then you can go on with your lives. We have, but it’s not easy.)
One more thing. If interest rates go up, yes, their cost of borrowing goes up, but so does the return from their investments. This is why we don’t get worried like the Street does.
Annaly is currently paying a dividend of 10.9%.
Economic Data This Week: CPI and Housing
Is inflation finely hitting the Fed’s target? We get some insights this week when both Consumer Price Index and core CPI are released before the opening on Tuesday. The consensus is for a big jump in both which is consistent with the resurgence of higher energy prices. Nevertheless, the news will reignite speculation in the interest rate futures market and this brings the FOMC back to center stage. We still hold strongly to the belief that interest rates will remain stable and that monetary policy is no longer as an effective tool for managing the economy as it used to be.
The Washington Data factory will be busy cranking out housing numbers this week with expectations for stability in the month of April. The word stability is not what option traders feast on but that is the way some weeks unfold.
Industrial Production and Capacity Utilization are normally two boring statistics but this week could be different. Believers in the theory that the economy is rebounding from a soft first quarter will be watching Tuesday at 9:15 AM. Our own theory is that expectations are too high and if things turn out that way, it will affect Tuesday trading, not in a positive way.
| RELEASE TIME (EST) |
REPORT TITLE |
PERIOD |
|
FORECAST |
PREVIOUS |
| MONDAY, MAY 16 |
| 8:30 am |
Empire State Index |
May |
|
9.0 |
9.6 |
| 10:00 am |
Home Builders' Index |
May |
|
-- |
58 |
| TUESDAY, MAY 17 |
| 8:30 am |
Consumer Price Index |
April |
|
0.4% |
0.1% |
| 8:30 am |
Core CPI |
April |
|
0.2% |
0.1% |
| 8:30 am |
Housing Starts |
April |
|
1.090 million |
1.089 million |
| 8:30 am |
Building Permits |
April |
|
-- |
1.076 million |
| 9:15 am |
Industrial Production |
April |
|
0.5% |
-0.6% |
| 9:15 am |
Capacity Utilization |
April |
|
75.2% |
74.8% |
| WEDNESDAY, MAY 18 |
| 2 pm |
FOMC Minutes |
April 27 |
|
|
|
| THURSDAY, MAY 19 |
| 8:30 am |
Weekly Jobless Claims |
May 14 |
|
N/A |
N/A |
| 8:30 am |
Philly Fed |
May |
|
3.0 |
-1.6 |
| 8:30 am |
Chicago Fed National Index |
April |
|
-- |
-0.44 |
| 10:00 am |
Leading Indicators |
April |
|
-- |
0.2% |
| FRIDAY, MAY 20 |
| 10:00am |
Existing Home Sales |
April |
|
5.40 million |
5.33 million |
Alibaba Group (BABA: $77, down 2%) Famous short seller Jim Chanos is betting against Alibaba. The company reported strong revenue growth last week, but now this quite powerful short seller revealed a short position in the company last week.
We’ve all heard that the Chinese economy is slowing down and some say it’s only a matter of time before it takes consumer spending with it. This is one reason Chanos thinks the stock is going lower but he also says that Alibaba doesn’t report the costs of its delivery operations on its U.S. financial statements. The company classifies the delivery segment as a separate entity. Chanos says that it uses up most of the company’s cash flow. He says that if the costs of the delivery operations are unknown, then it’s impossible to know the truth about their bottom line.
BMR Take: We don’t know and it appears no one else knows the true story either. This is why we have stated that we generally don’t invest in Chinese stocks. (We have always felt that there are enough stocks in the US to satisfy us and most investors.) We do hope that the authorities in China and this country wouldn’t allow a company to cheat or lie on their audited financial reports. One would think that there would have to be an awful lot of collusion among many professional firms and people for this to happen. Are we naïve? Maybe so. So this is about all we can say until the financials become more clear. We continue to remain bullish on the company.
We do know this: Chanos HAS a short position, which we assume to be large. But remember, a large short position is quite bullish.* We are watching closely and will update you via News Flash if our position changes.
*Because the shares have already been sold which has pushed down the price. The only thing a person with a short position can do is to buy back the stock, which is bullish.
Energy Corner - Market Commentary
Notes at the Margin
By Phil Verleger
www.VerlegerLLC.com
Phil Verleger is one of the foremost authorities on energy in the world.
Oil is behaving like a true commodity. Last week buyers and sellers learned that the Canadian “crop size” had been cut by the fires that destroyed Fort McMurray. Buyers and sellers also learned that production in Nigeria had been disrupted by terrorists. Argus Media reported that Nigerian output dropped to 1.65 million barrels per day, 150,000 barrels per day below the 2015 average. Further declines can be anticipated as the civil war in the country’s south resumes.
There were also more indications of problems in Venezuela. US news media reported Friday on fears of a coup d'état. Friday night President Maduro extended emergency rule, and there were widespread reports of looting. Meanwhile, PetroChina canceled plans to build a refinery jointly with the country. Existing Venezuelan refineries were operating at 50% of capacity. The available information suggests Venezuelan production may have dropped below 2.0 barrels per day even though the Venezuelan state oil company keeps telling everyone that output is 2.3 million.
There are hints that worldwide crude oil inventories will start declining in the next week or two. Market data are generally good predictors of changes in reported stock levels. One may conclude that global supply at this minute is less than global consumption. The data suggest that global inventories will rise by 700,000 barrels per day in the second quarter assuming OPEC production holds at 31.9 million barrels per day, non-OPEC production at 56.5 million barrels per day, and global use averages 95.3 million barrels per day.
Expect crude prices to move towards $50 per barrel next week as further disruptions around the world depress supplies.
Options Corner
We’ve covered a lot of ground in the Options world in the last few months. We’ve discussed covered calls, deep in the money calls, naked puts, naked calls. A strategy for you if you think prices are going lower would be shorting a stock and covering it with a put that you sell, but you know what? We would guess that only 1% of options investors would be interested in this strategy. And options investors are only 1% of the world of investors, so you are looking at only 1% of the 1% which would be .01% of investors out there. Our numbers may be an approximation but we hope you get the point. So let's not cover this. If you do wish to hear a discussion of this concept, please write us at Info@BullMarket.com.
Let’s do this: As noted above, we have discussed selling naked puts and naked calls. What about selling a naked put and a naked call at the same time? This is called a strangle. The advantage of this is that if you are wrong on one side of the trade, you will be right on the other. But also, it’s possible to be right on BOTH of them too, which can be very lucrative. Let’s use a real example. Let’s pick a stock that you have no idea whether it will go up or go down from here. How about IBM. IBM is a $148 stock and has ranged from $117 to $174 in the past 52 weeks. Is it going higher or lower? Hard to tell. What if you went out to January and sold the $170 call and the $125 put. The call is selling for $2.25 and the put is selling for about $4.00. (Note that the market is telling us it thinks the stock may go down more than it will go up. The put is $22 away from the current price and call is $23 away, about equidistant, but the price of the put is way higher than the call. Puts are more dangerous than calls of course (Why? Markets don’t CRASH to the upside. They mostly crash to the downside; thus more risk.))
OK. So you sell the put and the call. You get $6.25 per share in your account the next day. That’s $625 for the two options (each option is for 100 shares) or $6,250 for selling 10 puts and 10 calls. Now, the fun begins - you sit back and watch IBM. The ultimate goal is for the stock to stay between the two strike prices of $125 and $170. If it does, you get to keep the $6,250. The danger is if the stock goes up or down and approaches or surpasses the strike price. If the stock goes down, the put will go up in price and the call will go down. What you want is for the stock to remain CALM. If the stock stays around $150 you are a happy camper. If it heads lower, that’s fine as long as it doesn’t drop sharply and quickly. So if the stock moves to $130 or so over a few months, that’s OK, but what you don’t want is for the stock to drop to $130 in the first week or month of this trade. Again, your goal is for the stock to stay calm and stay in the middle of the two strike prices of $125 and $170.
You aren’t stuck with these two positions. You can always buy back one or both of the options at any time. So if the stock drops and gets too close to the $125 strike, you can buy back the $125 put and sell one that is further away, like the $120 or the $110.
The key to selling naked puts and calls is to be safe. Remember, you are living in a very risky world here. VERY risky. But the goal is to produce cash without having to invest any capital, but just by using the margin in your account from your existing portfolio of stocks.
Questions: Write us at Info@BullMarket.com. We love to hear from you.
High Yield Corner
In a week of broad market declines, several high yield sectors suffered much worse.
The S&P 500 lost half of 1% in a week of light macroeconomic data. Much of that decline was a result of Apple’s dramatic losses, which came mostly from renewed worries that the company’s decline in iPhone sales is just beginning. In addition, Retail was weak, as discussed above.
Yet other markets are hinting at underlying macroeconomic weakness that could also be contributing to stocks’ weak showing. REITs saw a drop, with the SPDR Dow Jones REIT ETF (RWR: $95) losing nearly 2%. Of course, part of this is a correction, since the ETF rose 7% from the start of 2016 to its peak earlier this week. But the weakness is also due to several REITs announcing earnings that were far from stellar. The strong fundamentals in REITs remain, but the market is realizing some may have been a tad overpriced.
In energy, MLPs saw a smaller decline, of a little less than 1.5% in the year as evidenced by the Alerian MLP ETF (AMLP: $11.90). The decline in MLPs is interesting. Oil rose by 5% during the week and MLPs have been closely correlated to oil since the commodity’s decline began in 2014, although management at many MLPs assured investors that their business model would not be negatively impacted by oil price shocks. The market didn’t listen, because it began discounting MLPs significantly, and the correlation lasted until just a few weeks ago, as we discussed here at The Bull Market Report. The decoupling in MLPs and oil prices may indicate that MLPs are trading much more on fundamentals, a good thing in our book.
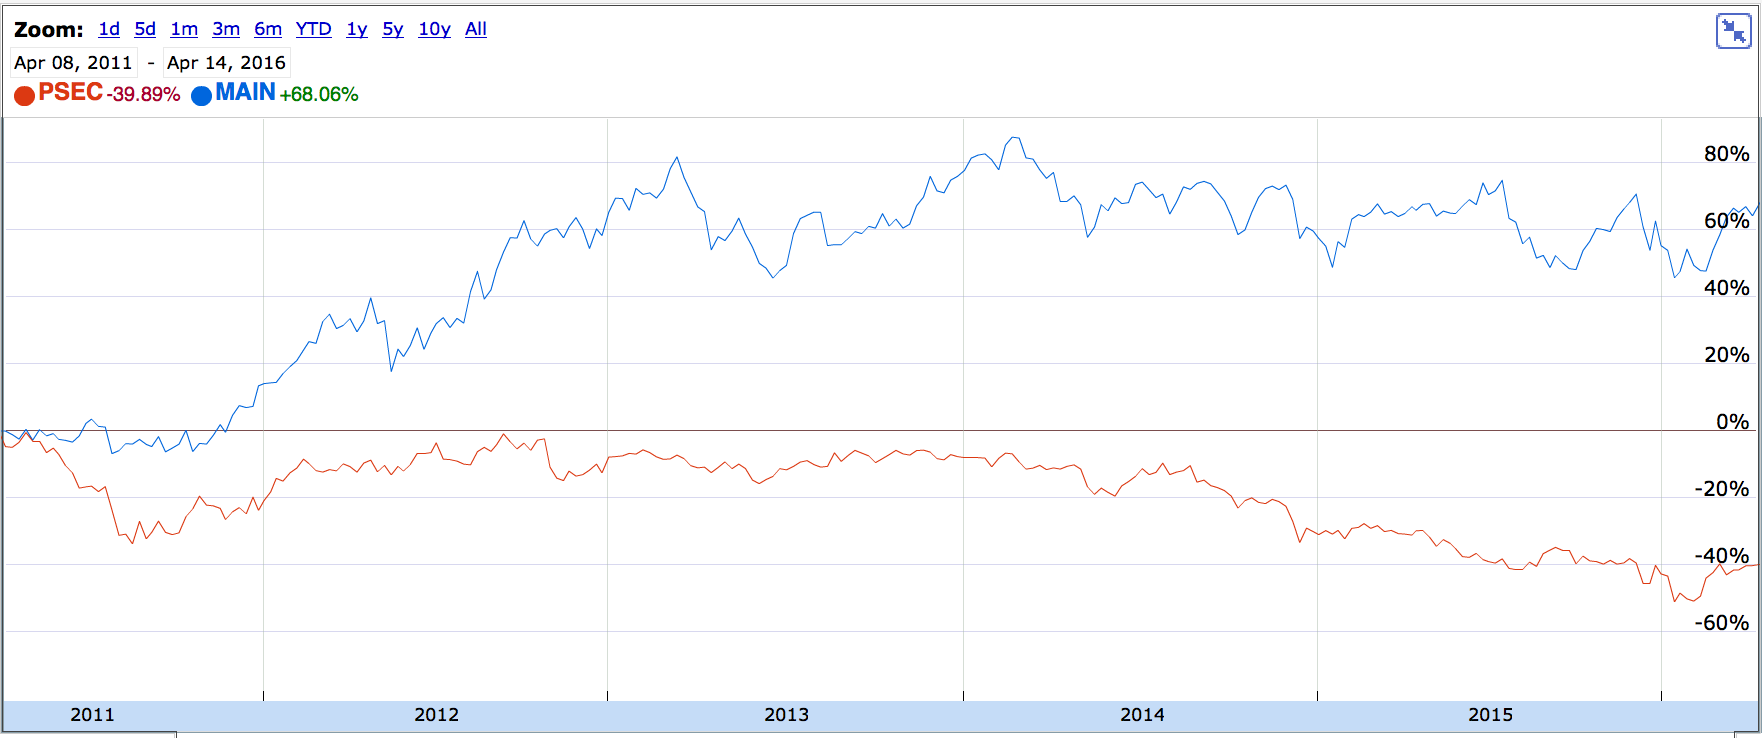
Earnings season for BDCs is mostly over, and the USB Wells Fargo BDC ETF (BDCS: $20) was up slightly as most companies reported better than expected earnings, as we discussed last week. Finally, we saw Prospect Capital (PSEC: $7.57) report earnings this week, and the company’s light decline in net asset value was not enough to keep the stock from gaining 3% this week. Fortunately, the company's dividend coverage remained intact, as BDCs are finding it easier to cover dividends with their net investment income.
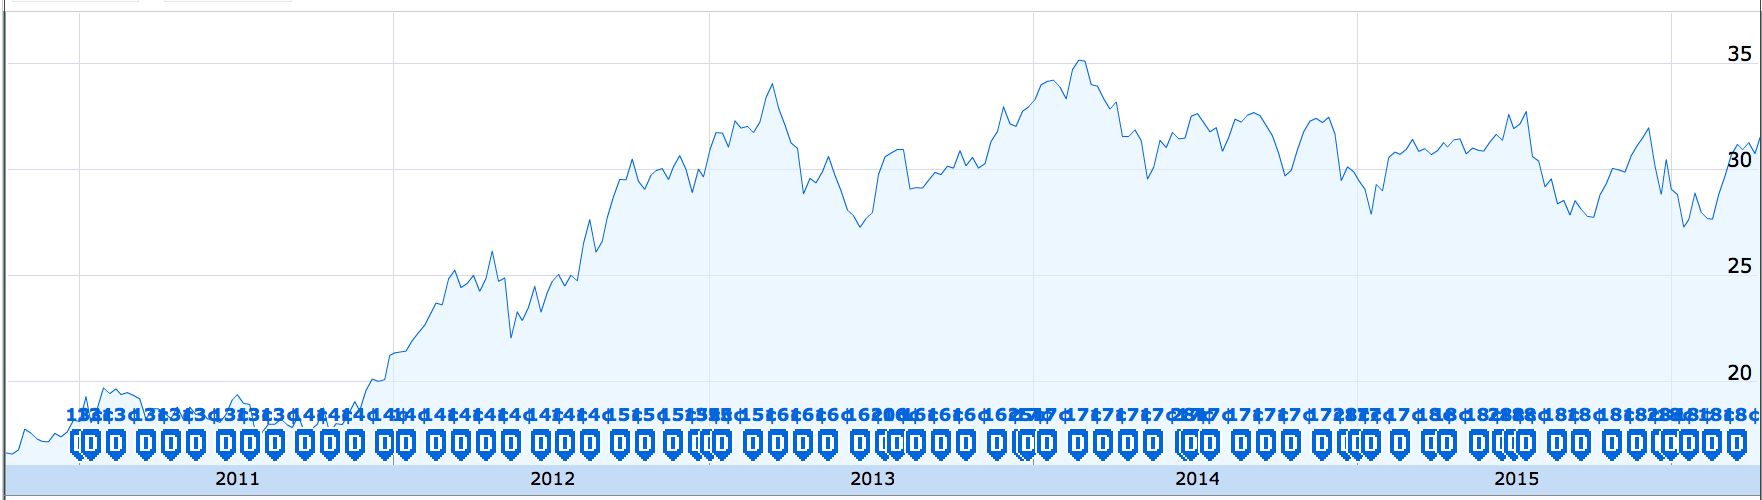
We still much prefer Main Street Capital (MAIN: $32), which had an increase this week of 1%. Its high net asset value and continually growing net investment income per share make us still believers. The BDC sector more broadly is looking much better for investors as a whole.
Todd Shaver
Editor in Chief
The Bull Market Report
May 8, 2016

by Todd Shaver | May 8, 2016 | Weekly Newsletter 7pm Sunday
Market Rally Runs Out of Gas
The market rally born on that February day two and a half months ago has been amazing with lots of money being created. But the rally is showing signs of getting long in the tooth.
It is now two weeks in a row that the market has pulled back with all major stock indices ending lower. For the week, Crude pretty much held its own in the mid $45 area (which amazes us and pleases us.) Gold, however, retreated for most of the week before attempting a brief rally on Friday. It didn’t last long once the Jobs data was released.
Renewed global concerns about the pace of growth in China sent the market on a downward course early in the week. But the big focus in the US equity markets was on company earnings reports. Based on the volatility alone, it is easy to conclude that the grand prize for biggest paycheck goes to the option traders. The divergence between the winners and losers, judging solely on stock price volatility had to do with management’s guidance for the future. Those who met or exceeded expectations for 1Q16 were rewarded. Those who met or exceeded but offered even the slightest downward bias in their outlook got taken to the woodshed.
Traveling the East Coast
We are traveling for the month of May and observing the state of the economy, as well as meeting with investors and corporate executives of companies we like or are thinking about adding to our portfolios. Our take so far is that the economy is strong and resilient, and it is our feeling that it will be very difficult to bring this economy down. It is just too robust. This country is huge. Every time we leave our home in Aspen to see the real world we are amazed. The traffic in Washington DC is out of control; the number of homes and buildings that are going up around the Beltway in Washington are literally astounding. Jobs are being created and in some sectors companies are having trouble filling them. With interest rates at the lowest levels in history, we see no reason for anything to change this year or next. We have a very strong outlook on the future of commerce in the country this year.
Here is How the Major Averages Performed
Is The Market Telling Us to Go Away in May?The Job Market: The Flower Wilted Last Week
Interest rate hawks got some bad news last week. Data on the job market took a surprising turn to the soft side. Wednesday’s employment report for April fell 40,000 below the prior month and set the stage for Friday’s government numbers on Non-Farm Payrolls. These were even worse, falling 50,000. As we know, a healthy job market has been the Fed’s main argument for raising interest rates. Well, this argument is obviously no longer valid. We know you are familiar with the fact that interest rate futures can predict markets: According to traders in interest rate futures, the first month where there is a greater than 50% chance of a rate hike is mid-2017. That is surprising to us so let’s look at other metrics to see how 2016 is going to play out.
One of the oldest pearls of wisdom dished out by market pundits is: “Sell in May and go away.” So far we have only a week’s worth of evidence but already there is a small voice in the background whispering this time-tested advice. To be clear, we are not sellers. Our goal here is to position you to make good investment decisions that will lead to great money making. Market corrections give us this opportunity. The reason most investors are unable to take advantage of bargain prices is a lack of cash. So it is time to get some cash ready as the opportunity is presenting itself.
The market by historic measures is overvalued. In the last 140 years, whenever the market is valued more than 20 times earnings, it is a sign there is limited upside. As of Friday’s close the S&P 500 was valued at 24 times. Granted that interest rates are the benchmark off of which stock values are set, and we appreciate that interest rates these days are near record lows. Under these circumstances, it is easy to fall into the investment trap of thinking, “this time is different”.
There have only been two times in history when valuations were significantly higher. The first was the dotcom bubble of 2000 and the second was in 2008 during the financial crisis. We aren’t naysayers, we’re opportunists – we are looking for value.
Knee-Jerk Reaction To Earnings
A key point to observe is investor reaction to earnings reports during the past two weeks. Those companies whose results have varied even the slightest from guidance have been punished with double-digit price declines. This alone suggests caution. Remember, markets overreact - it happens all the time. It is our job to spot opportunities.
So far the Dow and S&P stocks have held up the best so opportunity may be easier to find in the Nasdaq where weakness has been evident for a while. In the last month the index has fallen over 4%. A “correction” is not before a fall of 10% takes place, so we are not even close yet. But this we have observed: Whenever a stock market correction occur, very often it starts with the Nasdaq.
The composition of the Nasdaq is weighted with technology, healthcare and energy. In the past month, technology has been down more than 6%. This is the hardest hit sector owing to heavyweights like Apple (AAPL: $93, unch for the week), Netflix (NFLX: $91, up 1%) Twitter (TWTR: $14.40, down 1%), Alphabet (GOOG: $711, up 3%) and Microsoft (MSFT: $50, up 1%). But the correction in Tech stocks is broader. Last week the big cybersecurity stocks including Palo Alto Networks (PANW: $141, down 10%) and our favored play, Splunk (SPLK: $47, down 10%) joined the correction.
So Technology represents the first group of opportunities being presented to us, but Healthcare is not far behind. A good example from last week is Endo International (ENDP: $16.17, down 40%) a manufacturer of branded and generic drugs. On Thursday the company’s first quarter results beat guidance both in revenues and earnings. However, the company revised its guidance downward for full year earnings from $5.85 to $4.50 per share. This bit of honesty on the part of management cost stockholders a cool 40% in the stock. With this in mind, we will be watching Healthcare in search of opportunities.
Economic Reports This Week
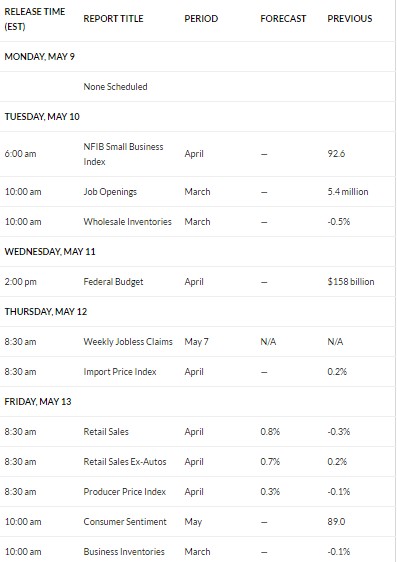
Investors who get easily bored of economic statistics will get a break with an unusually light calendar this week. The most important data point is on Friday with the Producer Price Index, which is expected to hit an annual rate of 3.6%. This would mark the biggest increase since December 2013. The number includes the pop in Crude prices, and is likely to produce a market reaction to the downside.
The other area to watch is Friday’s release of April Retail Sales. Economists are looking for 0.8% overall. This is a very ambitious forecast. So, overall, Friday is the most important day when the Washington Data Factory will have an impact on the market.
HIGH YIELD CORNER
The last week has been one of significant activity and significant stability in the high yield market, depending on which corner you look at.
Municipal bonds ended the week flat to close year-to-date up 1.5%, as evidenced by the iShares S&P National AMT Municipal Bond Fund (MUB: $112). The reason for the stability is quite clear: municipal bond defaults are rare and not rising. This is not the message many investors are getting, as the high profile non-payments in Puerto Rico have brought the municipal bond market back into the spotlight.
Besides defaults, municipal bonds tend to have less risk than corporate bonds or stocks, and their tax free payments make them attractive for retirees looking to receive tax-free income immediately. Defaults have remained absurdly low, far less than a tenth of 1%, according to Moody’s. That’s substantially less than the over 4% default rate that the corporate bond market is seeing, which is why municipal bonds pay a significantly lower yield than corporates. It’s also why municipal bonds and bond funds have considerably less volatile prices than corporate bonds.
And this was a bad week for corporates, especially high yield bonds. The SPDR Barclays Capital High Yield Bond ETF (JNK: $35) lost 1.7% with every day of the week slightly lower. As we noted last week, the junk bond market has been getting complacent, and in this week we may see that investors are getting a little too worried about that complacency. Yields on junk bonds have gone up over the last week, but remain still over 2 percentage points below their highest this year, indicating more price declines could be coming for the junk bond market.
Part of the pressure on bonds was a rash of disappointing results from Business Development Companies (BDCs.) Hercules Capital (HTGC: $11.90), Pennant Park Floating Rate Capital (PFLT: $11.70), Pennant Park Investment (PNNT: $6.10), THL Credit (TCRD: $10.55), Golub Capital BDC (GBDC: $17.10), Triangle Capital (TCAP: $17.40), and TPG Specialty Lending (TSLX: $16.00) all reported NAV declines, with Ares Capital (ARCC: $15.20) being the rare BDC to see a NAV increase. Worries about the quality of debt holdings and the ability of debtors to pay their debts are mounting, despite BDC price growth over the last few weeks. With these soft results, investors are being a bit more cautious about both BDCs and junk bonds.
With all the fears in the debt world, it was refreshing to see property REITs recover last week, as the SPDR Dow Jones REIT ETF (RWR, $97) shot up nearly 5%. That’s a strong recovery over the previous week’s declines, especially in the week before many REITs begin reporting results. Likely, the flow of money into some REITs is the result of investors predicting that the quarter won’t be as bad as many fear. So far, some big names have already reported with mixed results. Bull Market Report favorite Omega Healthcare Investors (OHI: $34) reported a 2 cent FFO beat that puts the already well-covered dividend in an even greater margin of safety, while the company’s full-year earnings guidance was reaffirmed.
Going into next week, we remain interested to see how the debt markets play out and whether a new risk averse trend is growing. The results in the REIT world will also have a major impact on the high yield market, while municipals will likely remain a constant in a sea of turbulent waters.
The Options Corner
Naked Calls
Last week we talked about naked puts which is a way to bring cash into your account with little work. It can also be a way to buy a stock you like at a lower price than it is at present. But it is very risky. This week, we’ll cover naked calls. First: Is this risky? YES IT IS RISKY. It is the riskiest type of option trading – equal to selling naked puts. Why? Because you can lose more than you invested. Repeat – you can lose more than you have invested. Why talk about this then? Because in moderation, selling naked calls can be very lucrative.
Start with a stock that you don’t think will go up. Many times we are good at this without knowing it – in other words, we try to find a stock that will go up and it goes nowhere. Of course this never happens at The Bull Market Report, right? Right! Let’s use real numbers. We can’t use a stock that we have in one of our portfolios because we are bullish on them all, by definition. So let’s go out and find a stock that we think will do one of three things – go down; go nowhere; or go up just a little. How about…….. Cisco? We actually like Cisco so we wouldn’t want to use this one. How about…… Valeant – Well, we secretly think the selling of the stock is way overdone and just might be the turnaround of the year. So that won’t work. What about Herbalife (HLF: $64)? You remember this one. This is the stock that Bill Ackman shorted heavily, went public with his position saying the company was a Ponzi scheme and saying it was worth ZERO (the ultimate short of course.) Remember? Well, Bill has lost at least $2 billion on the short and maybe as much as $3 billion. (Note what we said about risk above!) Friday the stock was up big as the company said it is in advanced talks to settle an FTC investigation into claims that it's a pyramid scheme. The stock was up $5 or 9% to close at $64.
OK, naked calls. WHAT IF you think the rise in Herbalife is about over? Remember, this is your decision and will be based on the situation that YOU believe will play out. Just like buying a stock like Apple that you think has great value and will go up, thinking that Herbalife will not go much higher for various reasons is your decision that you will act on and in this case, sell naked calls on.
Why does one do this? Option is a wasting asset. It has a value now based on what it is really worth (intrinsic value) and what people will pay for it since there is so much leverage (time value.) If the stock stays the same in price the intrinsic value won’t change, but as time goes by, the time value of an option will move towards zero. And if you SELL an option you get cash in your account and can sit back and watch the time value of the option go away, making you a little money each day.
The August options expire a little over three months from now (the 3rd Friday is on the 19th.) This works out to about 100 days, so the math works out really well here. Listen to this: The time value of the option loses about 1% every day. Get it? 100 days of life in the option - it loses 1% a day. So if you have $10,000 in options that you have sold, you make 1% a day, or $100 a day. Not bad. Now it turns out that an option that is out of the money is ALL time value. There is no intrinsic value. That’s perfect for what we want to do here.
Let’s look at some real prices. Herbalife is at $65 now and was up $5 on Friday. Let’s say that you think the run-up in price is about over and you don’t think it will go much higher. Let’s say you don’t think it will get to $70. Now you must ask yourself that question that we have suggested that you HAVE to ask each time you deal with options, and that is: What is the chance that Herbalife will get to $70 by August 19th? To be safer, you could look at the $75 price level too.
The price of an August 70 call is just less than $5 and the August 75 call is $3. Obviously there is less chance the stock will get to $75 than $70, right? So let’s analyze both. If you sell 10 August 70 calls for $5, your account will be credited with $5,000 the next day. (Note that you have to use “margin” to do this, but if you keep your portfolio at your broker, they will tell you how much margin you have and how many options you can sell. There is no cost for this.) Now, the fun begins. If the stock stays at $65 or so for two weeks, there will be 14 fewer days of life. There will be about 86 days left. The option should be worth about 14% less (yea). You will have “made” 14% x $5000 or $700. If the option heads towards $60, that’s even better. The further away from that dreaded strike price of $70 the better. But what if the stock heads towards $70? Then the option will generally rise in price which can put you in the red. The key is to kill the days off one by one, without the stock moving up sharply to the strike price. You want to get to August 19th and have the stock be under $70 so the option expires worthless. It turns out that your breakeven price for the stock is $75. Above that you start to lose money on the trade. This is on the day of expiration. If it goes to $75 in the first few weeks, this is not a good thing because there is so much more time left in the option’s life and the stock could go even higher.
If the stock goes to $80 you will be down at least $5 per share or $5,000. If it goes to $85, you are out $10,000. Do you see the risk?
But if the stock stays below $70, you stand to gain $5,000 by putting up just the margin necessary to do this.
And the “safer” $75 call for $3? That would put $3,000 in your pocket if the stock does not get to $75.
All for now. Next week we will talk about strangles, where you sell a naked put and a naked call on the same stock.
Discussion of Stocks in our Portfolios
AmerisourceBergen (ABC: $77, down 9%) is the most recently added name to our group of favored stocks. So far the stock has not lived up to its billing. Last week the company reported its March quarter ahead of guidance but lowered the outlook for 2016 EPS from $ 5.75 to $ 5.50. The reason for the change is in their generic drug business where deflation is greater than at any time in history. This is clearly disappointing but not a life threatening development by any measure.
The stock got hammered. At the end of last week, the price was at our sell point of $77. We are reviewing our research on the company and will let you know our thoughts on the stock this week. This we know with certainty: The stock is valued at 14 times revised earnings while offering a 2% dividend yield. Earnings are growing faster than average while the stock is valued at just over one-half the overall market. In a normal market these are very positive statistics.
Gilead Sciences (GILD: $85, down 4%) The stock drifted lower last week much to our surprise. The news a week ago on Friday that the Judge in the case of Merck vs. Gilead was reopening the case did not get much press coverage. We think it could be huge for Gilead. This completely opens the issue of who actually own the patents for Gilead’s Harvoni and Sovaldi and Merck’s Zepatier. Sales of these products are more than $12 billion, so this is a really big deal.
Based on false testimony by a former Merck employee, the March ruling of $200 million in favor of Merck is likely to be thrown out. Merck could actually end up owing Gilead for royalty payments on Zepatier. Gilead could even deny a license to Merck. This is extremely good news and makes us all the more excited about owning the stock.
Barrick Gold (ABX: $18.47, down 90 cents for the week) Barrick Gold has been solid for some time now, rising from the $16 level in mid-April to its present level, after hitting $19.40 a week ago. Gold itself has moved up $50 in the same time frame, so one would think the stock would have moved up. But this doesn’t concern us but in fact boldens us as we are confident that stock will catch up to the price of gold. If gold heads to $1325 and higher, we would expect to see Barrick above $20.
Netflix (NFLX: $91, up $1 for the week) Netflix is recuperating from an earnings report this week that made some on Wall Street a bit wary. We think this new lower price level makes the stock even more attractive. The more we read about this company the more we like it. As the internet continues to disrupt the world we live in (think Uber, Skype, Facetime, Alexa) the more we think Netflix can take a huge chunk of the TV viewing world from the Big Three – ABC, CBS and NBC. Amazon is already doing it; Hulu too. And soon Netflix. Watch out for Netflix. There is big money to be made here and we think this company will be a leader. And they continue to add subscribers to their base at a rapid pace and all of them are potential TV subscribers as well.
Facebook (FB: $119, up $2) Facebook continues strong. Some folks on the Street including some of our readers have decided to cash in their Apple and buy Facebook. They consider Facebook the future and Apple the past. We are certainly not going to say anything like this but we are just telling you this as food for thought. Facebook had a good week amidst a rough one for the market and many our stocks. They reported a huge quarter with big growth on the top line and big growth to the bottom line of profits as well. Zuckerberg says they are just in the 2nd inning.
The Energy Corner
Notes at the Margin
By Phil Verleger
www.PKVerlegerLLC.com
Saudi Arabia - Ministry of Petroleum IS OUT: Ministry of Energy, Industry, and Mineral Resources IS IN
The story next week and for the rest of the year will be Ali Naimi’s dismissal. Bloomberg reports that according to the Kingdom’s official news agency, the Saudi oil minister will be replaced by Khalid Al-Falih, chairman of Saudi Aramco. In addition, the mandate of the Ministry of Petroleum will be expanded as it becomes the Ministry of Energy, Industry, and Mineral Resources.
Al-Falih’s views on oil were captured in an April interview with The Economist. In it, he revealed that senior Saudis were worried about peak oil demand: Mr. Falih says that many policymakers in Saudi Arabia think that because of climate change, rising fuel efficiency and other factors, oil demand will probably peak before the supply starts to run out. The timing of peak demand is unclear, but whether it is 15 or 40 years away, he says the pressure is on to transform the Saudi economy: “If we end up being too anxious and calling it sooner than it really happens, it’s going to be for our betterment, because we will be ready sooner than others.”
With this background, it seems likely that Saudi Arabia will push for a change in OPEC’s direction. At the organization’s June meeting, expect the Kingdom to call on OPEC to become a reporting and monitoring agency, one that collects and publishes data.
Prices will not fall immediately, though. The fires in Canada, terrorist attacks in Nigeria, and the collapse in Venezuelan output will support crude for a time. Still, the long-term consequences are clear. Oil is the new corn. Indeed, oil has been the new corn for some time. Prices will rise when supply falls relative to demand, and drop when supply exceeds demand.
Apple Corner
Apple, the value stock(!), was unchanged this week at $93. In a week of weak earnings reports and a ho-hum stock market environment, hanging in there unchanged is a good sign for the future. We can’t imagine Apple going any lower so we would certainly add here at these prices. The company will be buying back its stock aggressively, so you might as well be on the same side of the fence as corporate Apple.
Under Armour (US: $39, down $5) The stock has been under pressure for a few weeks, but we are not concerned. We just stopped in an Under Armour store yesterday and the place was packed. We had to wait in line for a cashier. We use their products – they NEVER wear out and every athlete we know wears their stuff. Cotton is toast (disruptive); Under Armour is a stock to own for the next 10 years.
Good Investing,
Todd Shaver, Editor in Chief
May 1, 2016
by Todd Shaver | May 1, 2016 | Weekly Newsletter 7pm Sunday
The Good News and The Bad News
It’s true. The market finished April with the third month in a row of gains. The Dow gained 8%. The S&P 500 showed a 6.5% increase. Meanwhile the Nasdaq posted a 3.5% increase. That should all be good news - except for last week.
That’s when the market had it toughest period in over two months. Stocks in the Nasdaq fell the biggest. This caused a renewed bit of fear. The CBOE volatility index, generally considered a gauge of investor fear, jumped 10% to the highest level since mid-March - ^VIX: 15.70.
What was the cause of this newfound fear and trepidation? Earnings report season no less. It was a week of key earnings reports being joyfully good or painfully bad.
Elsewhere in world, Crude continued to march upward closing the week at $46, up another $2 while gold added 5% and the US Dollar was weak.
Here is how the week measured up:
| Key Market Measures (Friday Close) |
|
|
|
|
|
| Dow Jones |
17,774 |
-230 |
-1.3% |
| S&P 500: |
2,065 |
-27 |
-1.3% |
| Nasdaq |
4,775 |
-131 |
-2.7% |
| Crude Oil: |
$46 |
+2.00 |
+4.6% |
| Gold: |
1,295 |
+59 |
+4.8% |
We are now through the heaviest period of 1Q16 earnings season. One thing is quite evident. Woe be to those who disappoint. The list of some of those who disappointed includes Xerox (XRX: $9.60, down 14%), Goodyear (GT: $29, down 11%) and Corning (GLW: $18.67 down 11%). The cost was double digit declines for each. However, an equally big bomb last week was Apple (AAPL: $94, down 11%) followed by Gilead Sciences (GILD: $88, down 14%). Little wonder the Nasdaq ended the week in the dumps.
Before going into more detail on Apple and Gilead, there are several questions raised. If the market weren’t so highly valued, would the reaction to earnings disappointments have been so draconian? The answer is obviously no. But this is a key signal; something to keep in mind as we move forward. The second thing that jumps out when we compare these five companies above, is how much they reflect the broad base of the economy. In other words, are weak earnings a corporate level disappointment or, as the phrase was coined in the first Clinton Administration, “It’s the economy, stupid.” We raise this issue after pouring over the stack of quarterly earnings reports and noticing the large number of reporting companies that managed to hit their target EPS but were short of target on revenues. The past month has proven that our cautious attitude has been premature as the market rises to record levels. That’s OK; we prefer to protect your interests even if that means being a bit too conservative.
Mixed Results with the FANG Stocks
Facebook (FB: $118, up 7%) and Amazon (AMZN: $660, up 6%), were both rewarded after blowout quarters. Alphabet (GOOG: $694, down 3%) felt the pain of falling short both in revenues and earnings. Netflix (NFLX: $90, down 4%) reported last week showing solid results. More later about these stocks.
GDP: It’s The Economy
Data was pouring out of Washington at a fast pace last week. Unfortunately, it revealed the economy wasn’t moving much at all; only 0.5% in the first quarter. This was less than the often-reduced expectation of 0.7%. When the number was released before the opening bell on Thursday, it only added a bit more fuel to the market sell off.
Reports on the consumer front showed that people are getting cautious. Weekly Jobless Claims were pretty much on target. Personal Income grew a tidy 0.4% which also matched expectations. But Consumer Spending gained only 0.1%, half as much the previous month while both Consumer Confidence and Consumer Sentiment fell unexpectedly. And other measures of consumer behavior, like housing, showed disappointing results in both New and Existing Home Sales.
FOMC - The Family Feud Continues
Hope you weren’t surprised that last week as we failed to mention so much as a single word about Thursday’s Federal Open Market Committee (FOMC) meeting. That’s because, with the exception of the continuing public disagreement among its members, there was nothing worth discussing. Our take is that we still don’t look for more than one interest rate increase, at most this year. When this finally sinks in with the market, things should calm a bit and this should counteract some of the other negative news.
Technology: Changing Leadership
It is an interesting time for technology. The latest cycle in technology that began with the introduction of the first iPhone in 2004 has been long and glorious. Smartphones have helped usher in all the bells and whistles that followed like mobile computing, the Cloud, an App for everything, and on and on the list goes.
Even if the iPhone 7, when introduced this coming September, turns out to be truly awesome the Smartphone era is waning. Technology has been through this many times so there is nothing new here. The Cloud may still have a glorious future, but nobody would ever camp out for three days in front of an Apple Store to buy a Cloud. So, for investors and gadget freaks, the question is - what is the next “Big Thing” and when is it arriving?
The future is filled with some giant opportunities wrapped in acronyms like AV (Autonomous Vehicle), VR (Virtual Reality), and AI (Artificial Intelligence). Each of these is still a ways off.
Until that day arrives, gadgets are giving way to software and social media in answering the question: Who has the highest growth opportunities? This is why the light is shining so brightly on companies like Facebook and Amazon.
Economic Reports This Week
This week Washington Data Dump will provide a few additional economic clues. If 1Q16 GDP weakness is likely to continue, one sign will come on today at 10:00 AM with the Institute for Supply Management. It is the first and the freshest reading on how things shaped up in April.
The best read of the week on the consumer comes on Tuesday with Motor Vehicle Sales for April. Again, this is an early read on the month just ended and forecasters are looking for a 1 million-unit bump up in sales. This is very aggressive and offers a strong probability for disappointment. Earlier we pointed out how Goodyear had a disappointing first quarter. There is a reason we mentioned that. If tires aren’t selling, cars probably aren’t either.
For further information about this week’s earning reports please check out our Earning Previews report we emailed you Sunday and here on the website.
| Release TIME (ET) |
REPORT TITLE
|
PERIOD |
|
FORECAST |
PREVIOUS |
| MONDAY, MAY 2 |
|
| 10:00 am |
ISM |
April |
|
51.5% |
51.8% |
| 10:00 am |
Construction Spending |
March |
|
0.7% |
-0.5% |
| TUESDAY, MAY 3 |
|
| TBA |
Motor Vehicle Sales |
April |
|
17.0 million |
16.5 million |
| WEDNESDAY, MAY 4 |
|
| 8:15 am |
ADP Employment |
April |
|
-- |
200,000 |
| 8:30 am |
Trade Deficit |
March |
|
-$44.5 billion |
-$47.1 billion |
| 8:30 am |
Productivity |
Q1 |
|
-1.1% |
-2.2% |
| 8:30 am |
Unit Labor Costs |
Q1 |
|
2.4% |
3.3% |
| 10:00 am |
ISM Nonmanufacturing |
April |
|
54.7% |
54.5% |
| 10:00 am |
Factory Orders |
March |
|
-- |
-1.7% |
| THURSDAY, MAY 5 |
|
| 8:30 am |
Weekly Jobless Claims |
4/30 |
|
N/A |
257,000 |
| FRIDAY, MAY 6 |
|
| 8:30 am |
Nonfarm Payrolls |
April |
|
200,000 |
215,000 |
| 8:30 am |
Unemployment Rate |
April |
|
5.0% |
5.0% |
| 8:30 am |
Average Hourly Earnings |
April |
|
0.4% |
0.3% |
| 3:00 pm |
Consumer Credit |
March |
|
-- |
$17 billion |
Discussion of Stocks in our Portfolios
Alibaba (BABA, $77, down $3 for the week) Alibaba Executive Chairman Jack Ma and Executive Vice Chairman Joseph Tsai are spending $500 million to buy company stock as the Chinese Internet giant tries to shake off concerns that shopping on its sites will take a hit as China’s economy slows. This news is from late February but we thought it newsworthy to bring it to you. These two guys run the company and believe in it enough to put their money where their mouths are.
Following is an interesting story about Alibaba:
Chinese eCommerce giant Alibaba owns a 31% stake in Weibo. Weibo, which means “microblog” in Chinese, had 235 million monthly active users as of December, with Stephen Hawking the latest high profile figure joining the universe. Its revenue last year jumped more than 7fold from 2012. WOW. And unlike Twitter, it is making a profit.
Now enter Sina. Sina is a Twitter-like microblog social network, which has 55% of the Chinese microblogging market. The company has more than 500 million users with millions of posts per day, and is adding 20 million new users per monthly. Sina owns a prized a majority stake in Weibo. If Sina were to put their Weibo stake up for sale, Alibaba is the natural buyer. The good news: Alibaba has the right of first refusal. Apart from being Weibo’s second largest shareholder, Alibaba also contributed to most of Weibo’s revenue as Alibaba puts ads from its online merchants on the microblog.
Alibaba’s has plans to borrow up to $4 billion which has stirred up rumors that a bid for Weibo is forthcoming. Weibo’s shares have doubled since February as a result. But Sina is only up 27%. This means Sina’s 56% stake in Weibo now makes up about three quarters of its market value. Throw in the net cash and other Internet assets it owns, and Sina trades at a nearly 30% discount to the sum of its parts, assuming its portal business is worth nothing, according to an analyst at MCM Partners in Hong Kong. This raises an interesting possibility that instead of going after Weibo, Alibaba could pick up Sina instead. Alibaba has been acquisitive in the media space lately, buying Hong Kong’s South China Morning Post and the financial media firm China Business News. Sina’s assets, which include popular news and finance websites, may fit Alibaba’s media ambitions. Stay tuned.
Gilead Sciences (GILD: $88, down 14%) Gilead's 1Q16 results were below target and with that, the market severely punished the stock. Is this the end for Gilead? Not in the least. Here is what happened: During the first quarter, Gilead’s hepatitis C drugs Harvoni and Sovaldi saw $3.0 billion and $1.3 billion in sales, respectively. Analysts had expected $3.1 billion and $1.4 billion in sales so actual results were a shade light in both cases but certainly not earth shattering.
During the quarter, Merck (MRK, $55) introduced their hepatitis drug, priced considerably lower than Harvoni. This was known beforehand this so no one should have been surprised. We have little short-term concern because the potential market is so large. Harvoni and Sovaldi could rack up sales 2-3 times present levels. The market is that large.
Meanwhile after the close on Friday, Bloomberg News released a report that a Federal Judge had reopened the patent suit between Merck and Gilead. The existing ruling was favorable to Gilead, and although this move on the surface looks bleak, ironically, the judge’s action could be a huge blessing in disguise for Gilead. The judge cited perjured testimony from a key Merck witness. That could turn the whole case around putting Merck even more on the defense. We will keep you posted. In the meantime, we believe this is a great opportunity to buy the stock.
Alphabet
Google (GOOG: $693, down 4% for the week) The company showed consistent revenue growth, stable margins and gave cash back in the form of a $5.1 billion stock buyback last year. Last, but certainly not least, the company remains one of the best overall portfolio plays that focuses on the biggest Internet trends: The shift to mobile, wearable devices, video, the Internet of Things and much more. Alphabet delivers investors the full package.
The company reported results for the quarter that were below expectations, with JPMorgan calling it a “good quarter.” Despite missing expectations, the results overall were still very good, with revenue up 23%, and income growing 21% Y/Y on 1% margin expansion. JPMorgan lowered its price target to $925, with Wall Street consensus at $910, a lot higher than its current price. We would buy more here.
Thoughts on Upcoming Earnings for the Rest of the Quarter
From Gary Jefferson at Jefferson Financial
According to UBS, current earnings estimates now imply a growth rate of 1.5% for 2016, with a recovery in 2017 to 14% growth. If the already reported numbers are indicative of what the final outcome for the quarter will be, it looks like both the 1st and 2nd quarters will be on the bleak side, with most of the earnings being back-end loaded into the 3rd and 4th quarters. Baron's poll of money managers indicates that only 38% think the market is going higher. That makes sense – the market is a discounting mechanism, generally looking out 6 to 9 months into the future. There just isn't much "growth" expected this year. The way this scenario is shaping up, stocks don't have much room to rise until late this year when expectations may be better for mid- to late 2017.
Meantime, even though earnings don't look so bad given their greatly reduced expectations, fundamentally, global growth remains anemic and weaker earnings has caused a stretch in stock valuations. Mr. Market may be in a "consolidation" mood for a while.
Subscriber Question:
We had a question this week from a subscriber on why we have so many stocks in our portfolios.
[We don’t feel that we have too many stocks. We like to give you a choice.]
Here is what we wrote her:
Hi Margie –
We are sticking with about 20 companies in our Stocks for Success Portfolio. In the High Yield Portfolio, we are eventually going to have 15 or so, and Special Opportunities come up from time to time so we will add a few in this portfolio. We will be creating an Aggressive Growth Portfolio for those that are looking for bigger gains.
[Note: Please send us your thoughts at Info@BullMarket.com]
Apple Corner
Apple (AAPL, $94 down $11) had a good quarter but it wasn’t as good as the market wished. They sold 51 million iPhones; iPad sales were strong; the Apple Watch did well; their cash hoard went from $216 billion to $233 billion. In fact, for every share you own at $94, $42 of that is in cash – 45% of the stock price. This is an unheard of amount in the annals of investment. No other company still operating has had this much cash. They raised their dividend 10% and will be buying back more stock. Yes, Apple is now a Value stock. And what a value it is. If we owned it we would hold. If we didn't own it and were liquid and looking for a good investment, we would buy more here. Next year at this time the you will be happy you did.
Want to read about the Apple Watch on its 1-year anniversary? Good article here from a Tech Journalist:
http://mashable.com/2016/04/30/apple-watch-year-one/#VjEFEgk0sgqm
High Yield Corner
This was a fascinating week of significant contradictory divergences in the high yield world that is presenting significant opportunities to rotate holdings to take capital gains and get higher yields at lower prices.
Update on REITs: The property REIT world suffered a slight downturn last week but held up well compared to the overall stock market. The S&P 500 (^GSPC: 2065) fell 1.3% this week as investors mulled seemingly disastrous results at Apple (AAPL: $94, down $11), Gilead Sciences (GILD: $88, down $14), Twitter (TWTR: $14.602, down $2.60) and a few other companies, although it was a good week for Facebook (FB: $118, up $7) after they crushed expectations thanks to dramatically strong advertising revenues. The broadly weak earnings brought the market lower despite continued dovishness from the Federal Reserve, who hinted that a rate hike in June is possible, but not probable.
Property REITs suffered a small sell-off as a result, with the SPDR Jones REIT ETF (RWR: $92) ending the week down less than half of 1%, a performance matched by Realty Income Corp (O: $59), which fell about the same amount. Hospitality Properties Trust (HPT: $26) fell a bit more, at 1%, and was one of the hardest hit in the week.
But you should pay attention to the intraweek action. The week was mostly flat until Friday, when the SPDR Jones REIT ETF fell over 1% and Hospitality Properties Trust fell over 2%. That was the day when many REITs gave up their gains for the week, just as the S&P 500 suffered its major loss.
Friday’s price action is largely due to disappointment in the weak GDP spooking investors. With 1st quarter U.S. growth at just 0.5%, more investors have begun to worry that we are approaching a recession.
This has particularly affected stocks, but high yield bonds are being surprisingly resilient. While REITs are beginning to act in line with the stock market, high yield bonds are diverging. Friday actually saw a slight rise in the iShares iBoxx High Yield Corporate Bond Fund (HYG: $84), which rose to close the week up over half of 1 percent. Many bond Closed End Funds (CEF), like Bull Market Report favorite Pimco Dynamic Income Fund (PDI: $28), did even better; the Pimco fund ended the week up over 2%, and is still offering an income stream of nearly 10%, excluding special dividends, which it has been known to award recently.
Does this mean the debt world is getting complacent just as folks are getting fearful of equities? It seems so. The business development corporation (BDC) world had a slightly bad week, as evidenced by the Wells Fargo BDC ETF (BDCS: $21), which ended the week down 1%. That’s still better than the broader market, but isn’t exactly great. However, it should be noted that the BDC ETF did end Friday up as stocks were down, so it is holding the inverse correlation that high yield bonds are holding vis-a-vis stocks, as noted above.
The inverse correlation is actually much stronger if we ignore Prospect Capital (PSEC: $7.50), which suffered a 1.6% drop on a Deutsche Bank downgrade on concerns that its derivatives holdings are overvalued in its accounting. This brought the stock down 1.6% and brought the BDC market down with it, whereas Bull Market Report pick Main Street Capital (MAIN: $31) ended the week down less than 1%.
So if BDCs and high yield are remaining strong even as the market looks to turn lower, what can we expect going forward? Considering the big drop on Friday, we might be at the beginning of a mini-correction similar to - if not as bad as - the one we saw in February. The “sell in May and go away” adage may play out this year, although it hasn’t in previous years. But it looks like that trend will affect stocks first, and income second.
This could mean junk bonds and BDCs will lose value a short time after the market itself drops. If this trend plays out as it seems to be starting now, this could be a great opportunity to buy more high quality high income stocks while waiting for the market to come back to its senses.
Notes at the Margin
By Philip K. Verleger, Jr.
Energy Expert
http://www.pkverlegerllc.com
Venezuela Breakdown
The oil market story for 2016 is Venezuela. The country’s economic collapse has been spectacular. Within the last month Schlumberger (SLB) and Haliburton (HAL) have pulled out because they have not been paid. The firms that have been printing massive amounts of bolivar bills for the country have also not been paid. In February the media reported that the government chartered thirty-six Boeing 747s to bring additional currency in to meet the needs of citizens confronting seven-hundred percent inflation. The use of the planes brings to mind, in a much more inflated (pun intended) way, the experience of Germans ninety years ago. Back then it was wheelbarrows rather than 747s that shunted currency around, but the situation was just as dire.
This last week the Venezuelan government, attempting to deal with drastically reduced power supplies, ordered its employees to work only two days per week. Now all official business will be transacted on Monday and Tuesday—if, that is, workers can get to their posts.
The situation will degenerate. Last week people rioted in several Venezuelan cities. The uprising in one, Maracaibo, occurred after a twelve-hour blackout. Maracaibo is not just any city. It is the country’s second largest. It is also closest to the nations primary oil fields at Lake Maracaibo. The revolts are a harbinger of the breakdown of society in the country—and ultimately that of its oil production. The question is not if but when. Table 1 shows the potential effect of the collapse on IEA oil balances.
Historians will likely note the last week of April 2016 for the actions taken by Saudi Arabia to move beyond petroleum. On Monday, Deputy Crown Prince Mohammad Salman announced a $2 trillion program to change the direction of the Kingdom’s economy.
BMR Take: This mess in Venezuela will have profound effects on the world oil market as we know it. The Prince stated that they have no care whatsoever in the price of crude. $30? $70? They have couldn’t care less. Thus we believe they will pump like there is no tomorrow. Prices? Despite Venezuela: Staying lower.
Options Corner
Let’s talk about selling naked puts. First: Is this risky? YES IT IS RISKY. It is the riskiest type of option trading. Why? Because you can lose more than you invested. Repeat – you can lose more than you have invested. Why talk about this then? Because in moderation, selling naked puts can be very lucrative. It is a way to buy a stock at a lower price than it is now. Really? We like to say: Would you rather buy Apple at $94 now, or in three months at $86? (Love that question!) OF COURSE we would rather buy Apple at a lower price in the future than it is now.
OK, let’s use real numbers. Apple is at $94 now, as we know. The August $90 put is selling for $4.10 (let’s round it to $4). If you SELL this put, you are obligated to buy the stock at $90 if the put owner decides he wants you to do that. But since you got $4 for the put, your price would be $86. Get it? Now, let’s look at some scenarios on what could happen, and note that these are just a few of the possible scenarios. Remember, with options, there are countless ways to lose money. Thus the risk.
Scenario #1 – The stock goes to $85 a share by the expiration of the option. If this happens, you will be obligated to buy the stock at $90. Since you got $4 for the option, your cost will be $86, so you will lose $1/share. Not a big deal.
Scenario #2 – Stock goes to $80. Result: You will lose $6 per share. If you had sold 10 puts you would have lost $6000. (Each option is for 100 shares.) This is not a killer, but you would be out $6,000, but you would own the stock and if it rose to $86, you would be at breakeven. Of course, we are believers in Apple since it has $42 a share in cash and if it goes to $80, well over 50% of it would be in cash. How low can it go, really? (The ultimate question with this stock!)
Scenario #3. The stock stays in the 90s or goes higher. If the stock stays in the 90s you’re in good shape. However, you will NOT be forced to buy the stock. Hmmmm. Not good, you might say. We said above: Would you rather buy Apple at $94 or in three months at $86? So in actuality this is not really a yes/no question. Because if the stock stays above $90 you won’t be able to buy the stock at $86. BUT, you will have $4/share in your account. If you sold 10 puts, at the expiration in August you would have $4,000 in your account that you can spend. We say: NOT BAD! (Please check with your advisor before you do any of these naked options trades.)
You can reduce the risk a bit by selling a lower priced put, farther away from the current stock price of $94. If you think the stock could go to $85, maybe selling the $85 put is not a good idea for you. So why not sell the $80 put? What’s the price of that one? It is $1.40. So for 10 puts you would get $1,400 and it would be less risky, as your breakeven, instead of being $86 in the first example, would be $80 less $1.40 or $78.60 a share. What’s the chance of Apple going to $78.60? (Our favorite question. With no answer of course. But it is certainly less likely than going to $86. Get it?)
If you have options questions, write us at Info@BullMarket.com.
Good Investing,
Todd Shaver, Editor in Chief
April 27, 2016
by Todd Shaver | Apr 27, 2016 | 11am News Flash
Apple Inc. (AAPL: $98, down 6) reported 2Q16 earnings after the markets closed yesterday. They reported $1.90 in earnings on $50.6 billion in revenue, compared to consensus estimates of $2.00 on $52 billion in revenue. Last year saw $2.33 in EPS on $58 billion in revenue. Gross margins totaled 39.4% versus 40.8% in the same period last year. International sales were 2/3rds of revenue.
Here are some numbers:
iPhones totaled $33 billion in sales on 51 million units.
iPads totaled $4.4 billion on 10.25 million units.
iMacs computers totaled $5.1 billion on 4 million units.
Services (iTunes, etc.) netted revenues of $6 billion.
Other products (including the Apple Watch) netted revenues of $2.2 billion.
Apple raised its dividend 10% to $0.57 per share, which will be payable on May 12, to shareholders of record as of May 9. That’s a current rate of 2.3% per year. The company announced an increase of $50 billion in its program to return capital to shareholders and plan to spend a total of $250 billion by the end of March 2018.
In terms of guidance for the fiscal third-quarter, the company expects revenues of $42 billion, with gross margins in the range of 37.5%. Consensus estimates for the third quarter are calling for $1.76 in EPS on $47.3 billion in revenue. The consensus analyst price target is $134 a share – the all-time high.
BMR Take: Apple is a value stock now. There is no debate any more. How much lower can it go? $90? $85? With $233 billion in cash, $42 of the stock price is in cash. This is unheard of in the annals of investing on Wall Street. Pure and simple, they had a bad quarter compared to analyst expectations. Compared to our expectations they had a good quarter. In three months’ time we will be closer to the announcement of the iPhone 7 and with a strong stock market the stock should hold steady and start to move higher by the end of the year. Would we sell here? Not a chance.
Twitter Reports Earnings
Twitter (TWTR: $15.00, down $2.70)
Here is some analyst commentary from the Street:
Morgan Stanley: NEUTRAL
Rating: Underweight
Price Target: $14.50
Comment: We see the steep deceleration in ad revenue continuing to pressure the multiple that investors are willing to pay for the stock as we now see their core on-platform ad revenue growing at a slower rate than Google's Website business and Facebook's ad business in 2016. We are assuming Twitter's ad business re-accelerates in the back half (due to the NFL, presidential election and the Rio Olympics), which, if advertiser demand doesn't improve, still could be aggressive.
Deutsche Bank: BULLISH
Rating: Buy
Price Target: $23 (cut from $25)
Comment: The commentary around the macro advertising market validates our thesis that 1Q trends are slowing and that pockets of weakness are emerging. We are trimming our revenue and EBITDA estimates for 2017 by around 10%. At $15, or $10 billion in market cap, we think there is strategic asset value at Twitter. The only catalyst to get the stock turned back up is stabilizing revenue growth, which we see showing up in 2H16.
Raymond James: BULLISH
Rating: Outperform
Price Target: $19 (cut from $25)
Comment: Twitter remains early in its turnaround plan, and we continue to expect increasing product improvements and advertising monetization improvements (i.e., targeting, measurement) in the back half of the year and into 2017. While disappointed with the lower revenue outlook, we maintain our Outperform rating as we believe shares at around $15 (9 times 2017 EBITDA) largely reflect the lower outlook. Improved execution in late 2016 and into 2017 could serve as a catalyst.
Wells Fargo: BULLISH
Rating: Overweight
Price Target: NA
Comment: Management offered broadly positive commentary on the impact of new product initiatives designed to grow its user base and deepen engagement, though active users and lukewarm forward commentary (e.g., expect no significant Olympics catalyst) will likely dispel any thesis that a positive user growth inflection point is in the making.
BMR Take: Twitter reported stronger-than-expected earnings of $0.15 per share. Revenue grew 36% Y/Y to $600 million. But their guidance for 2Q revenue was light, at a range of $600 million versus $675 million expected (but $600 million in the quarter is a still a big number.) Twitter beat on user growth, 310,000 versus 305,000 in 4Q15. They have $3.5 billion in cash and only $1.6 billion in long term debt.
This seems like a good quarter to us.
Listen, Twitter is in the Special Opportunities Portfolio for a reason. It is a turnaround situation and it is taking longer than we and others on the Street would like. If you bought the stock at $17 you might want to get out now with a small loss. The stock could easily go to $11 before the big turnaround begins. $9 if the stock market heads back to 17,000. Can you stand the pain? Should you buy more at $15, at $13? Some on Wall Street think Facebook and Google will eat their lunch. We don’t think so. Twitter is a unique business with a strong history of changing the world in such a short time on the planet. We believe they will survive and thrive. But do you have time to wait? That’s the question you need to ask yourself as an investor.
April 17, 2016

by Todd Shaver | Apr 17, 2016 | Weekly Newsletter 7pm Sunday
Special Note: We are going to publish our 2nd Earnings Preview Monday morning. Netflix (NFLX) is the first to report Monday after the close and then there are a bunch on Wednesday – Kinder Morgan and Qualcomm, and a few more on Thursday. We can’t wait to send it to you.
LAST WEEK: Oil prices continued to strongly influence U.S. equities, and on the whole, with crude rallying sharply on news of potential Saudi and Russian production freezes, markets enjoyed bullish sentiment. Sledding was a bit tougher last week than the one before, however, as earnings season kicked into full swing - causing market participants to exercise a bit more caution, even in the wake of the previous week’s dovish interest rate posture from the Fed.
No Deal From Doha:
Oil ministers from around the world are meeting over the weekend in the Qatar city of Doha. In times past this might have sent Crude prices soaring and equity prices tumbling. The exact opposite was the case last week with Crude virtually unchanged and stocks enjoying a good week, across the board.
Investors have come to discount any outward signs of unity in this group. Politics is where this group has nothing in common. So, no reliable agreement restricting output is in store. We think very little will come out of this meeting as Iran has not agreed to appear. Saudi Arabia is upset and going to close the store and take all their marbles home like a sore loser. The net result is that they will continue to produce oil at high levels, which can only cause lower prices since demand is so low worldwide. We’ll know more later this week.
THIS JUST IN: No Oil-Freeze Deal at Doha Meeting
Delegates from more than a dozen oil-producing countries who gathered in Qatar this weekend hoping to freeze crude output failed to clinch a deal, according to ministers leaving the meeting late Sunday. It was unclear if oil officials from Russia and Saudi Arabia, the world's two biggest producers, and most OPEC members, would try to reconvene again, either later Sunday night or on Monday.
The futures just opened. Stocks down 11 S&P points; crude down $2.50 to $37.65. Nasty.
Here is how the week ended:
| Key Market Measures - Friday Close |
|
|
|
|
|
| Dow Jones |
17,898 |
+321 |
+1.8% |
| S&P 500: |
2,081 |
+34 |
+1.7% |
| Nasdaq |
4,938 |
+23 |
+0.5% |
| Crude Oil: |
$40 |
UNCH. |
UNCH. |
| Gold: |
1,236 |
-6 |
-0.5% |
Fire the Forecasters: What Inflation?
Last week was just chock full of market moving data. In last week’s Bull Market Report we listed the estimates of all of Wall Street’s leading economic soothsayers. The only trouble is, these expert forecasters missed every estimate with the exception of one. What is the adage about a blind squirrel finding an acorn?
Inflation, or the lack thereof, was the spark that ignited Tuesday’s rally. The key Producer Price Index was down 0.1% for March compared to a 0.3% increase expected. The March PPI included the price spike in Crude. This means the core PPI dropped more like 0.2%. Very quickly investors realized this news put a dagger in the hearts of the Fed’s interest rate hawks. The only logical thing that followed was to buy stocks aggressively. And that is pretty much what drove the markets to levels within striking distance of all-time highs.
Investors were further encouraged by Thursday’s lower than expected report of The Consumer Price Index and Core CPI. If this trend in data continues in the months ahead, the Fed will have no reason to increase interest rates anytime this year.
Financial Stocks Back from the Abyss
At long last, Financial stocks came to life as the group ushered in the 1Q16 round of earning reports. JPMorgan Chase (JPM, $62, up 7% for the week) provided the spark on Wednesday with better than expected results. To be clear, applying the term “better than expected” really means, “less miserable than we feared”. Those fears are based on factors like the Y/Y decline in stock prices, a soft underwriting calendar, and paper-thin interest spreads. Wall Street expectations were reduced to the minimum. Stocks got taken to the proverbial cleaners. That is what makes financial stocks like these so attractive: Bank of America (BAC: $14.00, up 9% for the week), Goldman Sachs Group (GS: $159, up 5%), The Blackstone Group (BX: $29, up 8%) and Annaly Capital Management (NLY: $10.40, unch.) Any half-decent news and these stocks will take flight higher.
Note that we saw a successful IPO this week. Shares of BATS Global Markets (BATS) jumped 21% to $23 after the exchange operator went public, the first non-healthcare IPO of 2016.
Auto Market In Trouble
The recent unveiling of Tesla’s Model 3 so far has resulted in reservations for nearly 400,000 units of the sleek new $35,000 model. The first deliveries won’t take place until the next president of the United States delivers his or her first State of the Union address in 2018 but thus far, Elon Musk has succeeded in raising $400 million in capital without the need of an investment banker or filing a registration statement with the SEC, all from the $1,000 deposit put down by its buyers. Pretty smooth work Elon! No wonder the stock is approaching its 2015 high.
As for the rest of the Auto industry, things are not so great. We have been digging through lots of data for months now that point to a slowdown. Wednesday’s data on retail sales confirmed it has happened. Except for Tesla, we have no other recommendations in the Auto industry for which we are quite happy. However, since autos, along with housing, have formed the backbone of economic strength for several years, this is not great news in general for investors.
A Fiscal Fix Is Needed
If, as we have often suggested, monetary policy has run out of gas, how does the economy get fuel for growth? For the past 75 years, the answer was simply, have Congress spend more money. With $20 trillion debt and a Congress that is frozen, spending more is not an option.
We see that the big problem the Fed fails to recognize is the quality of the US labor force in relation to the high paying skills needed. Worker skills in a manufacturing economy are a poor match with the preponderance of high paying jobs being created in Technology. And with technology changing so rapidly, today’s job skills are becoming obsolete faster than any time in history. There is a major gap here as Silicon Valley and the whole Tech industry has thousands of unfilled jobs while the true level of unemployment, the E6 number, remains close to 10%. (E6 is the broad measurement of unemployment including people who are unsuccessful long term job seekers that have left the labor force entirely. In other words this includes people that lack the skills to fill existing job vacancies.)
With this in mind, we applaud this week’s announcement by Oracle chairman Larry Ellison. He is donating $200 million to the government’s effort to train students in computer coding. This is creative fiscal stimulus. If the concept spreads throughout the Tech community, it could create new opportunities for investors. Keep your fingers crossed. Smart thinking Mr. Ellison.
Upcoming Economic News
This week the Washington Data Machine shifts from inflation to housing. Monday, Tuesday and Wednesday are the days to watch. Existing Home Sales is the most likely to have market impact, as this has been weak recently.
On a broader scale, the total Housing picture is important to stocks, since Housing, like Autos have been key economic drivers. We will be keeping an eye on this data sending out our thoughts during the week.
| Release TIME (ET) |
REPORT Title |
PERIOD |
|
FORECAST |
PREVIOUS |
| MONDAY, APRIL 18 |
| 10:00 AM |
Home Builders' Index |
April |
|
-- |
58 |
| TUESDAY, APRIL 19 |
| 8:30 AM |
Housing Starts |
March |
|
-- |
1.18 million |
| 8:30 AM |
Building Permits |
March |
|
-- |
1.18 million |
| WEDNESDAY, APRIL 20 |
| 10:00 AM |
Existing Home Sales |
March |
|
-- |
5.1 million |
| THURSDAY, APRIL 21 |
| 8:30 AM |
Weekly Jobless Claims |
4/16 |
|
N/A |
N/A |
| 8:30 AM |
Philly Fed |
April |
|
-- |
12.4 |
| 8:30 AM |
Chicago Fed National Activity Index |
March |
|
-- |
-0.29 |
| 10:00 AM |
Leading Indicators |
March |
|
-- |
0.1% |
| FRIDAY, APRIL 22 |
| 9:45 AM |
Market PMI Flash |
April |
|
-- |
51.5 |
|
|
|
|
|
|
High Yield Corner
It was another great week for High Yield. All sectors ended the week in the green, including a surprising resurgence in the world of MLPs. Alerian MLP ETF (AMLP: $11.04, up 1.3% for the week), which has struggled significantly throughout the year. Even in weeks when oil surged, MLPs failed to recover, so this week’s movement is significant. The movement also came on no news, which may suggest investors are calling a bottom in this asset class.
Caution is needed here. MLPs are closely correlated to many asset classes, including the S&P 500. Already some analysts are calling for a pullback after the market has skyrocketed 12% since its lows in January. Whether that happens or not depends on earnings season, which has just started. Unfortunately, things kicked off poorly with Alcoa (AA: $10.00) seeing sales fall 15% on a Y/Y basis, guiding lower due to a disappointing growth rate was the Airline sector. The company will cut an extra 1,000 jobs.
Things aren’t all bad, though. The banks are actually doing very well, with strong earnings results coming from Citigroup (C: $45) and JP Morgan (JPM: $62) offsetting news of Goldman Sachs's (GS: $159) $5 billion settlement for fraudulent transactions related to the 2008 crash. This is good news for the BDC world, as seen by the strong showing of the UBS Wells Fargo BDC ETF (BDCS: $20), which ended the week up 1%. As lenders to mid-sized companies, BDCs are benefitting from the same tailwind helping the big banks: More lending activity for companies as they begin investing more heavily in growth.
Similarly, high yield bonds - as seen in the iShares High Yield Corporate Bond Fund (HYG, $82) - rose over 1% for the week as investors forgot their fears of growing defaults in the Energy sector spreading to the rest of the market. The week’s action left HYG up over 2.5% YTD and BDCS flat YTD, excluding dividends.
Property REITs, as seen in the SPDR Dow Jones REIT ETF (RWR: $94), were the weakest this week, essentially closing flat after a strong Friday showing. We are two weeks away from the REIT earnings season, and this will be a crucial one. Many REITs are still down in the past year after a significant pullback, even if funds from operations (FFO) show a strong Y/Y growth rate. Now that sentiment is improving, REITs will need to show more FFO growth to get their stock to rise further. If they fail, a sharp reversal of the 9% gain over the last three months may be in order.
The Options Corner
We thought we would show you a concept of attempting to produce fairly strong returns by buying a stock and immediately selling an at-the-money call on it. This is a strategy for sophisticated investors only, so get your broker and advisor involved before you try any of these ideas because in the short few paragraphs below it is impossible to tell you about all the scenarios that can play out. So by definition, this description will be somewhat superficial. AND RISKY. But we are looking to produce a 10% gain in a month or two. Did we say RISKY?
The concept is this: Buy a stock you like and that you think the stock might stay steady or go up in the next 30-60 days. Then immediately sell an at-the-money call on it. Let’s look at some numbers. How about one of favorites Solar City (SCTY: $29, up 4% last week). Say you buy 1000 shares at $29. Then you sell the May $30 call, which is trading for $2.25.
The cost of the stock is $29,000. But selling the 30 call brings in $2.25 per share or $2,250. So your net cost is $26,750 [($29-$2.25 = $26.75) x 1000 shares]. If the stock stays at $30 or higher until the expiration of the option on May 20th (3rd Friday of the month for ALL options), your stock will be called away at $30, which is exactly what we want to happen in this trade. Let’s look at your cash position. After the stock is called you will receive $30,000 for the stock and since your investment was $26,750, you will have made $3,250 for a return of 12% in a month. Not bad.
Let’s look at a negative scenario? What is the downside risk? (After all, no one is going to hand you a 12% return in a month without some risk, right? What if the stock goes to $27 by May 20th? If this happens you have lost $2,000 on the stock but since you got $2,250 for the option, you are at about breakeven. (Your exact breakeven price is $26.75.) At this point, you can turn around and sell a June option bringing in another $2,000 or so, thus lowering your breakeven to around $25 a share. Get the idea?
Again, many, many things can happen during these months so it is not as easy as it looks, but selling at-the-money calls on stocks that stay the same or move higher can be very lucrative. Would you like to see another example next week? Write us at Info@BullMarket.com.
The Energy Corner
Notes at the Margin
By Phil Verleger
http://PKVerlegerLLC.com
Last week saw several important developments in the global economy related to the oil industry. Most who follow oil closely will focus on the results of the Doha meeting completed yesterday. [Results are not complete yet, although we know there was no agreement to cut production, so stay tuned.]
Several other events of note took place. First, on Tuesday the International Monetary Fund issued its annual world economic outlook. The report made for dismal reading. The bleak outlook was summed up succinctly in an opinion piece published in Financial Times by Olivier Blanchard. His summary is grim:
“According to the IMF, slow growth is now a fact of life after 2009.
“Productivity growth has dropped sharply, especially in Europe. It has fallen in the United States as well.
“The slowdown in advanced economies explains slowdowns in emerging markets.”
Blanchard offers the disturbing observation that “bad news about future potential growth can lead to a recession.” He explains that companies, seeing bad prospects for sales, cut investments, while consumers, confronting prospects of stagnant income, cut consumption. It is not the optimistic view one wants to read:
“If this new narrative is right, the baseline forecast is for slow but continued recovery.”
Under these circumstances, those hoping for strong increases in global oil use over the next two or three years need to go back to the drawing board. Demand will grow slowly. Price increases, if they are to occur, will require significant cuts in supply.
A more significant development was the announcement that Schlumberger was leaving Venezuela. It seems the firm has not been paid. Schlumberger’s departure is further demonstration of the nation’s destitution. Later, the country’s oil companies offered “take it or leave it” contracts to the companies producing with it. We guess most will choose to leave.
Finally, on Saturday The New York Times printed a front-page article “Saudis Tell U.S. to Back Off a bill on 9/11 Lawsuits.” The piece explained that Saudi Arabia would immediately remove [sell] its investments in the US - including a large holding of treasury bills - if the law were passed. While the chance of this is remote, this threat should be taken seriously. The economic consequences could be severe.
US Crude Oil Production Fell for the Tenth Consecutive Week
The U.S. Energy Information Administration released its “This Week in Petroleum” report on April 6th. It reported that the weekly US crude oil production fell marginally by 14,000 bpd (barrels per day) to 9 million barrels per day for the week ending April 1st, compared to the previous week. Production fell for the 10th consecutive week. It’s the lowest level since November 14, 2014. The monthly US crude oil production peaked at 9.7 million bpd in April 2015.
North Dakota crude oil production fell for the third month in a row, ticking down 0.4% in February and hitting its lowest level in 18 months. Slumping oil prices are starting to affect output in U.S. shale fields, including the prolific Bakken formation in North Dakota. Oil production in the state dropped to 1.1 million barrels a day in February, down a tick from January. The state’s output hasn’t been that low since July 2014. The slightly lower production in February follows a 2.6% drop in January and a 2.5% slide in December. The Bakken formation is one of the highest-cost sources of U.S. production. The state’s drilling rig count, a barometer of future production, stands at 26 active units, down from 32 in March, showing the fewest rigs at work in oil fields since 2005. At its peak, North Dakota had 218 rigs drilling in 2012.
The Gold Corner
In a new research report, Merrill Lynch raised price targets on many of the gold stocks that they cover. They like a number of stocks and one of them is Silver Wheaton (SLW; $17.05), what they call the largest pure precious metals streaming company in the world. Forecast 2015 estimated production is 45 million ounces of silver, and 225,000 ounces of gold. By 2019 production is anticipated to increase to approximately 55-60 million silver ounces, and 325-330,000 ounces of gold.
Silver Wheaton has 20 long-term purchase agreements in place. It has silver and gold interests all over the world so they are diversified as to country political risk. The company is currently paying a 1.2% dividend. The Merrill Lynch price target is $20 a share with the consensus target on the Street at $22.
If you wish to hear about more ideas in the gold and silver realm, let us know at Info@BullMarket.com.
Portfolio Trackers
Have you checked out our Portfolio Trackers? They are on the website at the bottom of the portfolio pages. Go to “Our Portfolios” and click on one of the portfolios and then scroll down to the bottom of the page. There you will find all the info about the stocks we have in each of our portfolios – Stocks For Success, Special Opportunities, and High Yield. All the details are right there in front of you. We love this new feature of The Bull Market Report.
BMR Companies and Commentary
Our Stocks for Success and Special Opportunities portfolios have been carefully selected to provide diversification and best in class in each sector. Last week was the beginning of 1Q16 earnings report season with Bank of America reporting earnings on target. We will be sending out our new Bull Market Report Earnings Previews providing you with a weekly update throughout earnings season on our favored stocks. We think you will find it helpful and look forward to receiving your comments.
Fitbit (FIT: $17.20, up 19% for the week) The stock is a long way from it high of $52 last August but steady progress is rewarding investors. From the February low of $12, the stock is making a strong comeback.
Last week was a leap in the right direction with the stock gaining a stellar 19%. So here is what happened: On Wednesday analysts at both Citigroup and Pacific Crest recommended the stock and raised their estimates, pointing to sales for their newest product, the Blaze, as the main reason. The Blaze competes directly with the Apple Watch but at a lower price of $200 versus $300. Blaze is on fire, selling over 1.3 million units since the late February launch.
Finally the momentum is shifting in favor of Fitbit stockholders. The Citi analyst has a price target of $30. Fitbit has scheduled the 1Q16 earnings report for May 2. The consensus is $0.02. Citi just raised their number from $0.01 to $0.04. Not terribly exciting in real numbers, but exciting enough to get the stock moving higher big time.
Twitter (TWTR: $17.60, up 6%) Many times investing contrary to conventional wisdom can be rewarding. For some time we have held this belief with regard to Twitter. The stock is well down from the 2014 high of $65. Many investors gave up when the company languished. Yet the Twitter mindset is every bit a part of today’s culture as ever; it just needs some sprucing up.
Founder Jack Dorsey’s recent return to run day-to-day operations started to turn heads. The missing ingredient is that social media, more and more, is turning to video, and Twitter needed to take action to stay relevant. The April 5, agreement with the National Football League to live stream 10 Thursday Night Football games created the big headline. What is less well known is that Twitter paid less than $1 million per game. That compares with $45 million per game at CBS. Nice going Jack.
Devon Energy Corp. (DVN, $31, up 9%) was raised to Buy from Hold and the price target was raised to $40 from $30 by one analyst. It has a consensus analyst price target of $32. Devon paid a 24 cent dividend on March 31st maintaining the dividend it paid in 2015 of 96 cents per year. In February, Devon announced a 75% reduction in the quarterly dividend on its common stock, which will bring its 2Q16 dividend to $0.06 per share. The reduced dividend will provide over $320 million in additional cash flow. Thus the company’s indicated annual dividend rate for 2016 is $0.42 per share.
Devon has $2.3 billion in cash and $10.8 billion in debt. The firm is a bit over-leveraged, but management is dedicated to getting the debt level down to more meaningful levels. We are watching this development closely. The stock is up 68% now since we added it the Special Opportunities portfolio in February with a target of $28. Because of the sharp run-up in the stock we hereby raise the Sell Price from $15 to $27, locking in our gains. The Target Price is hereby raised as well to $37.
Trader’s Corner
This section is designed to bring you some different ideas for short term traders.
Cashing in On Cannabis with Zynerba Pharmaceuticals, Inc. (ZYNE, $9.59)
(We’ve got an interesting one for you this week, but the market cap is TINY so be careful out there! Read this if you have an open mind and want to learn about a micro-cap. At $90 million, this is not a typical Bull Market Report stock. But we want to bring you all facets of the investing world, so here goes!)
If the number 4/20 doesn’t mean anything special to you, then you probably haven’t been following developments in the emerging, multi-billion dollar legal cannabis industry. Long ago cannabis users co-opted the police penal code for marijuana possession - 4/20 - and turned it into a national day of celebration every year on April 20th. With another 4/20 holiday set for mid-week, it’s a good time to identify a related trade.
Regardless of where you stand on the legality of cannabis, the drug has gained increasing acceptance in the U.S. and abroad, for both medical and recreational use. Currently, opportunities to invest in cannabis companies are almost exclusively limited to over-the-counter traded issues, as a gamut of dicey legal uncertainties continue to pose significant business challenges. There are, however two firms in the industry trading on the Nasdaq: GW Pharma (GWPH: $82 with a market cap of $1.8 billion), based in the UK, and the subject of today’s alert, Zynerba Pharmaceuticals.
Founded in 2007, Zynerba Pharmaceuticals is a specialty pharmaceutical company developing and commercializing proprietary synthetic cannabinoid therapeutics. Its products candidates include ZYN002 and ZYN001 - synthetic transdermal cannabinoid therapeutics for various types of pain that people have including refractory epilepsy, osteoarthritis, fibromyalgia, and peripheral neuropathic pain. (Transdermal means applied through the skin, like a patch.) Earlier this year, the FDA granted orphan-drug designation to ZYN002 cannabidiol (CBD) gel, for the treatment of Fragile X syndrome. In addition, Zynerba has already secured patents related to ZYN002 and ZYN001, with two in the U.S., five in Europe and two pending in Canada and Japan.
In August, 2015, ZYNE shares came to market in the IPO at $14, amid a great fanfare, in the wake of the growing trend among U.S. voters and lawmakers to usher in laws allowing the use of medical marijuana by adults, as well as legalization in Colorado, Oregon and other jurisdictions. The appeal was clear: an increasing number of studies, as well as countless anecdotal stories, documented the many beneficial effects of CBDs - one of the active ingredients in pot - for helping a wide variety of conditions.
With a tiny public float of five million shares, which gave the company an initial market cap of $48 million, the issue surged to an opening day top of $22 before closing at $16.25. By the time the buying frenzy peaked soon after the IPO’s debut, Zynerba had touched a 52-week top of $43. From there, the issue had an epic fall from grace, tumbling all the way to $5 during the early 2016 market meltdown.
We don’t currently own any ZYNE shares so there is no conflict of interest here, but we are watching closely for a potential buy of shares next week. No doubt the small float, the story behind the stock, and bull market conditions, helped put Zynerba on traders’ radar, with that $43 mark unsustainable and arguably irrational - giving Zynerba a momentary market cap of about $350 million.
When GW Pharma recently announced extremely encouraging Phase III results for its CBD-derived drug to treat epilepsy, however, ZYNE once again surged north of $20, before profiteers knocked the stock price back down to under $10. Around the same time GW Pharma shares more than doubled overnight, jumping from $35 to $80, where they currently remain. We wouldn’t invest in GW Pharma at this point, but would consider it if the stock were to drop to the $50 level, a level probably not in the cards for a while.
Our hunch is that cannabis stocks will grab the spotlight again this 4/20 week, making Zynerba worthy of monitoring for some potential momentum trading gains. Longer term, there’s the potential for significant buying catalysts as the company navigates the serpentine path to FDA approval. ZYN002 is currently being evaluated in a Phase 1 trial in healthy volunteers and patients with epilepsy, and the company expects to report results from that study in the next three months. In addition, the company’s proprietary transdermal technology, if successfully developed, would be the first product on the market providing sustained, consistent and controlled delivery of therapeutic levels of two cannabinoids: cannabidiol (CBD), and THC, the principal constituent of cannabis.
On the political front, several more states are expected to usher in the medical and recreational use of cannabis during November’s election, with California and its $2.7 billion cannabis market leading the charge. Just as significantly, later this year the Federal government will consider delisting cannabis as a Schedule 1 drug - in the same category as heroin - which has proved to be a huge barrier to the industry’s growth and acceptance.
If you haven’t traded low-float issues like Zynerba before, it’s not for the faint of heart or risk averse, and obviously there’s no guarantee that 4/20 will be a stock price catalyst. Longer term, however, Zynerba could emerge as an industry leader in the promising field of medical cannabis treatments.
By Analyst Jon Slotnik
For The Bull Market Report
MAIN STREET CAPITAL (MAIN)
A NEW ADDITION to our HIGH YIELD PORTFOLIO
Key Measures
52-Week Price Range: $24-$33
Shares Outstanding: 50 million
Market Capitalization: $1.6 billion
Dividend: $2.70 per share
Yield: 8.7%
Target Price: $40
Sell Price: $26
Price at time of publishing - $31
Fundamentals and Company Overview
Main Street Capital Corporation is a Texas-based Business Development Corporation specializing in lending to smaller middle market companies with revenues between $50 million and $500 million. Most lending is in the form of a senior debt that must be paid back in the case of a bankruptcy or company liquidation, although Main Street will also do smaller deals of subordinated debt and equity, which carry slightly higher risk.
Part of Main Street’s value proposition to investors is its ability to manage risk by identifying which companies are solvent enough and have the highest growth potential to be offered higher-risk credit, and which companies deserve any credit at all. With a two-decade history and over 200 companies in its portfolio in that time, Main Street has proven its ability to find companies that have growth potential and quality credit.
Portfolio Quality and Leverage History
The company’s portfolio is weighed towards senior debt, but Main Street has a history of using riskier equity investments to boost overall investment returns, providing extra income beyond the debt portfolio that can be used to pay special dividends (which it has done for the last four years). Here is CEO Vince Foster on the portfolio structure in February: "We continue to seek and receive significant equity participation in our lower middle market investments and as of quarter-end, we owned an average of 36% equity ownership in the 96% of these investments in which we currently have equity exposure."
The company’s portfolio has shifted towards larger companies, with 40% in lower middle market firms, 36% in middle market, and 14% private loans.
Main Street has also maintained what is a low debt-to-equity ratio by BDC standards. Having stayed around a 75% debt-to-equity ratio for three years, Main Street has been able to keep a balanced portfolio even as it has increased its Net Asset Value (NAV) significantly, and has issued new shares over the years, discussed below.
NAV Trend and Dividend Track Record
Main Street increased dividends in March 2015 and two special dividends in 2015 of $0.275 per share each. Including those dividends, Main Street’s yield is over 8.7%. Since going public four years ago, the company has consistently raised dividends while also issuing special dividends every year:
At the same time, the company has also seen steady capital gains as a result of a higher NAV thanks to the company’s high quality investments:
In 2015, the company’s NAV rose 4% per share on a Y/Y basis. However, it should be noted that the company’s NAV since then has fallen 2% largely as a result of the company’s energy exposure. Nonetheless, the company’s overall performance in its investments is impressive. For example, the company’s investment in energy service provider irth Solutions (that IS the correct spelling!) earned the company a $6 million return on an equity stake and an internal rate of return of 40%.
While such staggering returns aren’t always to be expected, the company is very good at earning returns of between 8% and 12% on its credit offerings to firms, while keeping costs lower than many other BDCs. Its expenses are usually about 1.5% of its assets under management - a low figure considering fees are over 2% for competitors like Prospect Capital (PSEC: $7.30). Furthermore Main Street has significantly outperformed them in both dividends, capital gains, and NAV growth.
Risks and Considerations
The biggest risk with Main Street is its exposure to energy. In the past, it has invested nearly 10% of assets in energy and energy-related companies, but has recently shied away from the industry by recognizing investor concerns about taking on too much exposure to oil prices, as CEO Vince Foster said during the third quarter earnings call: "We probably would not be looking at new service type, energy service type investments. I don't think that our investors, our lenders and our [bankers] particularly don’t want to see us having much more in a way of energy exposure, particular on the service side."
Another consideration is that Main Street is trading above net asset value, when some BDCs are trading at significant discounts. Prospect’s current discount of around 30% makes it appear to be a bargain, while Main Street’s 45% premium to NAV looks like a foolish overpayment.
The easy counterargument can be made with one chart:

A more cogent response would be to bear in mind that the market has priced in expected mark-to-market discounting of Prospect Capital’s portfolio, which contains several leveraged loan derivatives that analysts have argued are overvalued. While Prospect has already discounted some of these, causing its NAV to fall, more discounting is expected. Main Street, however, has no such derivatives in its portfolio.
BMR Take:
All considered, Main Street can be considered one of the lowest risk 8% yielders on the market. Even forgetting the special dividends, a 6.9% dividend growth stock is incredibly good, and the risks from its energy exposure and premium to NAV look to be fairly inconsiderate relative to the company’s track record of high returns by investing smartly in growth-positioned firms.
Finding an entry point is difficult, however; Main Street is up 14% from February’s low point and is 5% below its 52-week high. The BDC sector has substantially outperformed just about everything else as the market realizes just how oversold the sector was earlier this year, making timing purchases tricky. If a market correction comes, Main Street is a definite buy at any point below $30, but buying now will still secure a solid income stream for many years to come.
Good Investing,
Todd Shaver
Editor in Chief