by Scott Martin | Dec 13, 2019 | 7am News Flash
From a good Fed outlook to rumblings about a breakthrough on trade, istocks that struggled over the past year are breaking new records.
The trade deal is reportedly all ready but the final paperwork. If so, Phase One is happening before the end of the year and tariffs on Chinese exports set to kick in on Sunday will be scrapped. In return, China will start buying U.S. agricultural products again. We're looking at $40 billion flowing to our farmers from the pork-starved people of Asia.
This is good timing for the Chinese, who have recently been reeling in the face of nearly 20% food inflation. And the news is good for U.S. consumers who were staring at steeper prices on about $500 billion in products. Some of those proposed tariffs will roll back today. The others are now on the table for renegotiation.
Every BMR stock now has a constructive catalyst on its side. In particular, the high-growth stories that soared to high valuations early this year now have their growth scenario restored. If the trade war was the factor clouding these stocks' prospects, a trade truce should logically clear those clouds, right? And since uncertainty itself was what was really holding many of these companies back, now that we know the shape of a deal, everyone can finally start moving forward again.
This means that corporate plans put in place a year ago can get executed. Budgets can be made and money allocated to strategic initiatives. Big software packages can be bought, installed and used. And the companies that support these initiatives can sign the contracts they had in the bag a year ago. That money has no reason not to come in now. All the revenue they saw coming will arrive.
Take a fresh look at Aggressive and Technology stocks that have fallen from big heights "because of growth fears." The reason to question their growth trends has evaporated. And we know where the stocks can go when there's no fear in the way. These companies soared in the first place because the businesses are moving so fast.
One example: Alteryx ($95, down 12% this week). It fell recently for no reason anyone can point to beyond "growth fears." Management couldn't figure it out. Analysts were clueless. But if the biggest drag on growth just evaporated, the people trying to talk this company down don't even have talk on their side any more.
by Scott Martin | Oct 7, 2019 | Free Newsletter (Sent Weekly Monday at 12pm)
The Weekly Summary
We talked about "rotation" throughout September. Last week the circular forces of market sentiment gave us a big win, with our Aggressive portfolio surging 5% and our High Technology recommendations adding another 4% to that score. As a result, the BMR universe as a whole made some nice progress while the S&P 500 dropped 1%. Any week where you keep making money in the face of a broad market decline is a good one.
We have a track record of outperformance to maintain. Thanks to this week, our YTD is once again close to double what the S&P 500 has produced. BMR stocks are up 33% compared to 18% in the broad market. Looking toward the final quarter of a bumpy year, we're excited to see how much farther we can extend that lead over the next three months, no matter whether Wall Street pivots up or down.
All the twists in last week's market mood played out in our daily News Flashes. If you didn't get those, you're not a subscriber. Want a free trial? Let us know!
If the bulls are back in charge, our stocks have more room to run before straining historical limits. Despite the volatility of the last few weeks, the S&P 500 is only 2% from its record peak. The BMR universe, on the other hand, has already absorbed a full correction without losing their aplomb or endangering their YTD gains, so we don't need to break any records to keep this rally going.
Either way, we have a strong defense to go with our high-scoring recommendations. As the coming earnings season evolves, the end of 2019 could play out like what we saw last year or finally give investors a reward for their long-term perseverance. A year ago, Wall Street was on the verge of a serious correction. Having already stomached a lot of that downside this time around, we see no reason our outperformance can't continue no matter where the S&P 500 twists.
That twist may go down. While Friday revealed that the job market is pensive enough to justify at least one more interest rate cut, the trade war, stalled earnings, and indifferent economic data keep many investors on edge. The Fed now has a tight needle to thread. If rates go down because a strong economy isn't generating inflation, Wall Street will cheer. However, every hint of a recession ahead will feed the negativity that is already holding some of our favorite stocks back.
We'd rather live in a boom and swallow the occasional rate hike than watch the Fed struggle to keep the economy from stalling. But until corporate earnings demonstrate that the boom is back, investors will vacillate and stocks will spin. The good news is that the next quarterly earnings cycle starts on October 15 with the big Banks. Once the season gets underway, we'll know a lot more about how the year will end.
There’s always a bull market here at The Bull Market Report! Want a free trial? Let us know! Let's get to work. It's going to be an interesting week.
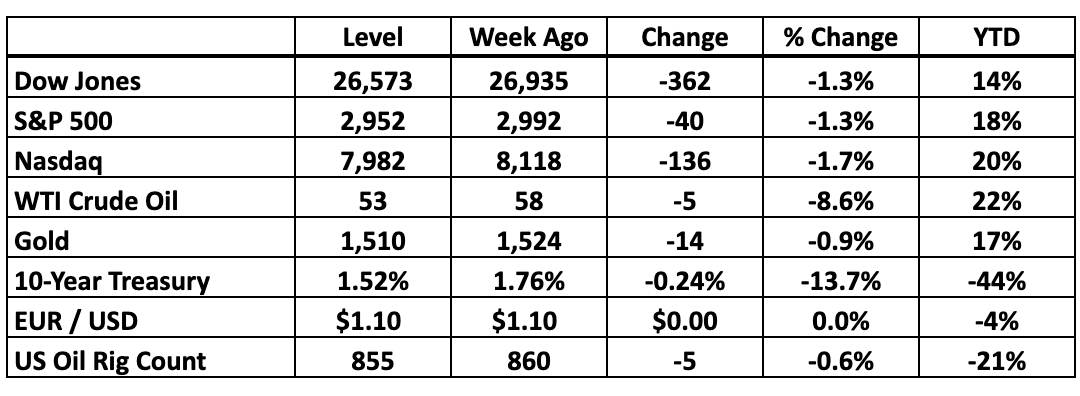
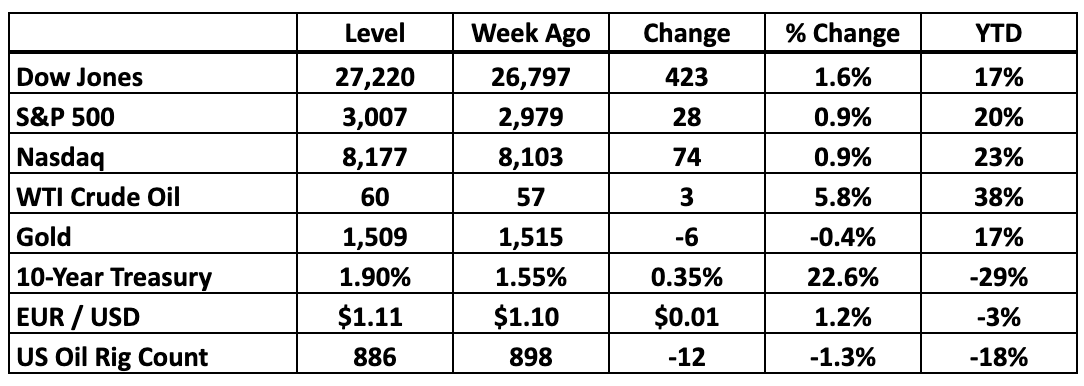
Key Market Indicators
-----------------------------------------------------------------------------
BMR Companies and Commentary
The Big Picture: The Dogs Of Fear Aren't Barking
After another week of yield-paying sectors smashing all-time records while the high-tech heart of Wall Street remains depressed, other investors are starting to hum the refrain we started singing last week. Money is flowing into Utilities, Real Estate and Consumer Staples at the fastest rate in years, stretching normal valuations and leaving more dynamic areas of the market gasping.
In our view this is less about a true flight to safety and more about investors around the world reaching for better income than what they can get in the Treasury market or in overseas bonds that pay negative interest. That’s an important distinction. No matter what you hear, we aren’t facing a lot of fear right now. We’re dealing with a species of greed.
Risk tolerances haven’t collapsed. Bond yields around the world have. And as money inches out of bonds in search of reasonable returns, yields in the stock market follow bond rates lower.
We’ve talked last week about the premium risk-averse investors are paying for relief from recession anxiety without having to accept the negative inflation-adjusted income they’d get from Treasury bonds. If prices are climbing 1.7% a year and the Fed won’t raise rates before inflation hits 2%, buying middle-term government debt will leave you with less purchasing power when those bonds mature than what you have now.
That’s only an acceptable strategy if you’ve abandoned hope for anything in the global markets doing better than breaking even. We’re naturally on the side of doing better. So are like most realistic investors who recognize that the world is a long way from the point where locking the doors against absolute disaster is the only move that makes sense.
However, some moves only make sense because every other option has a worse outcome. That’s where we think Utilities and Consumer Staples stocks are now. They’re not objectively bad as places to park cash ahead of an economic storm. But when you see better alternatives as we do, these sectors look bloated and on their way to outright bubble territory.
Utilities, for example, usually command a slight premium because their dividends are about as reliable as it gets, and people will pay extra for that kind of clarity. However, that premium has expanded a lot in the last few months. Three months ago, these stocks were available for 19.1X earnings against an 18.4X multiple for the S&P 500 as a whole. As of last week, the S&P 500 valuation hasn’t changed while Utilities are at the point where they cost 20.9X earnings to buy in.
Admittedly, Utilities still pay a 1% higher dividend yield than the S&P 500, but when you’re weighing whether to lock in 2.8% or 1.8% (before factoring in inflation) nobody is reaping huge windfalls here. That’s why we tend to skip the sector in order to focus on Real Estate, where yields remain higher, especially on the specific stocks we recommend.
But the real arbiter of value in a defensive portfolio is the amount of extra income investors can squeeze out of the stocks they pick while their money is parked. With Treasury debt, the rate you lock in is the interest you’ll receive. The odds of a default are as close to zero as it gets. Everywhere else, you’re accepting a little risk that a company will run out of cash and cut its dividend or skip a payment.
The higher the spread, the greater the perceived risk. Treasury rates have reached 1.35% so the bottom of the risk/return curve is almost as low as it gets right now. Five-year bonds bottomed out at 1.26% at the end of 2008, when it really looked like Wall Street’s world was ending and overnight lending rates were effectively zero. Back then, Utilities paid 4.2% to reflect the elevated risk that these companies would fail to meet their shareholder obligations. The spread naturally rose to roughly 3 percentage points. A lot of people were scared.
What happened, of course, is that the sector didn’t even blink. It would take a disaster greater than 2008 to interrupt the income investors receive here. And because the spread between Utilities and Treasury yields has narrowed to 1.5 percentage points (half what it was in 2008), the bond market is signaling that default risk has receded a lot over the past decade.
Likewise, we can track the spread between “defensive” yields and what investors get from the S&P 500 as a whole. Normally we expect Utilities to pay 2.4% more than the broad market. The spread is now barely 1 percentage point wide now. There just isn’t a lot of room left there for more money to crowd into the sector before the risk curve breaks. Back in 2008, for example, the yield spread between Utilities and the S&P 500 narrowed to barely 1.2 percentage point. We’re close to that historical limit now.
We’re lingering on this math to give you a better sense of how the current rush to defense is distorted in any reasonable historical context. If the world right now feels like it did at the end of 2008, then locking in these abnormally low yields and compressed risk spreads makes sense as the best way to sidestep any significant economic threat. Otherwise, the math doesn’t add up. The usual statistical indicators that accompany real fear in the market simply aren’t there.
To borrow a line from the Sherlock Holmes stories, the dog isn’t barking. Maybe there’s no dog.
And in that scenario, money will soon flow back out of overcrowded yield stocks into what are now underrated areas of the market. Our High Technology and Aggressive portfolios are already rebounding and unlike a lot of defensive stocks, have a lot of room to continue their rally. We know how high these companies can go when Wall Street is in an optimistic mood and as fast as their fundamentals are expanding, the ceiling keeps rising.
After all, the thing about locking in a yield is that you’re also locking out a lot of upside. We’re willing to do it with Real Estate and Big Pharma because those companies are dynamic enough to generate additional cash from year to year. That cash then feeds into additional dividends or gives investors a reason to buy the stocks at ever-higher levels. In our view, they’re in the sweet spot between a strong defense and enough offense to stay open to ambient economic growth.
However, locking in less than 3% elsewhere in the market right now locks out a lot of upside. How high can Utilities go, for example, when earnings in the sector are inching up 2% a year? If the stocks rally much faster than that, already-stretched valuations get even more extreme until finally there just isn’t any justification to keep buying.
The market as a whole, meanwhile, tends to beat Utilities by at least 2 percentage points a year. Our stocks do even better. The slow years aren’t great but the fast years more than make up for them, while our own high yield recommendations provide a cushion to encourage patience through the rough spots in the economic cycle.
Knowing that a portion of our universe is paying 5% (the REIT portfolio) to 7% (the High Yield recommendations) gives us that cushion and that patience.
NOTE: In our weekly paid subscription Newsletter, we do between 5 and 7 SnapShots and also support regular Research Reports. The last three stocks we recommended are already up 5% apiece. Plus, we have the Weekly High Yield Investor, whereby we discuss the 17 stocks in our High Yield and REIT Portfolios.
And to top it all off, we send News Flashes each day during the week. Got a question about any stock on the market? We'll answer. So if your favorite stock reports earnings or there is significant news, you will hear about it here first. If you want the whole picture, join the thousands of Bull Market Report readers who are making money in the stock market and subscribe here:
www.BullMarket.com/subscription
It’s only $249 a year, and later this year we will be raising it to $499 or even $999 a year, it is just THAT valuable. But we will lock you in for life at this lower price.
Good Investing,
Todd Shaver, Founder and CEO
The Bull Market Report
Since 1998
Subscribe HERE:
www.BullMarket.com/subscription
Just $249 a year, soon to go up to $499. But you are guaranteed the SAME PRICE forever.

by Scott Martin | Sep 23, 2019 | Free Newsletter (Sent Weekly Monday at 12pm)
The Weekly Summary
Rotation worked against us early this month but now the inevitable market pendulum swings back in our favor. BMR stocks rebounded nearly 1% last week, led by a stunning 6% surge in the Aggressive portfolio. Evidently these companies weren't as "toxic" as some people on Wall Street wanted us to believe. Those who sold the dip are regretting their lack of conviction now. Those who bought, on the other hand, are already making money.
That's what it's all about. While a few of our highest-flying recommendations remain a magnet for opportunistic negativity from analysts looking to make a name for themselves, it's hard to get too worried when we've watched this game play out many times in the past. A stock that climbs 300% can afford to give up a lot of that ground in a very short period of time . . . and longer-term shareholders will barely even flinch.
With the BMR universe once again up 60% in the aggregate, we're not quite in flinch-free mode yet, but we acknowledge that volatility cuts both ways. Stocks that fly tend to fall fast. As long as they fly more than they fall, we simply keep our eyes on what ultimately matters: performance. That's part of what this week's Big Picture is about. Our recommendations aren't just up 60% in their time with us (compared to roughly a 12% time-adjusted return for the S&P 500). They're up 13% over the trailing 12 months . . . a period where the market as a whole stalled.
Right now our stocks are still in correction territory while the S&P 500 is back around record levels. When rotation finishes playing out and BMR stocks catch up to where the broad market is now, this is the kind of environment where alert subscribers can boost their lifetime scores quite a bit.
And then there's the Fed. As recent News Flashes discussed, we got that 0.25% rate cut after all. Jay Powell didn't have any surprises up his sleeve and said as much in the press conference. He's watching the same data points we are. When they stack up to a rate hike, we'll know. Otherwise, it looks like interest rates will decline as long as inflation remains below 2%. We like that a lot. It pulls money out of Treasury bonds into higher-yield investments like the ones on our portfolios. And it supports the economy, feeding growth and giving our more dynamic stocks plenty of room to move.
People can try to find a negative long-term spin there, but once again, it's hard to argue coherently that this is anything but good news in the short term. Meanwhile, the trade war seems to have calmed down for a few weeks. The Saudi oil production outage was a non-shock as far as the market was concerned. Earnings season is coming. Now is the time for investors to shake off months of dread and capture opportunities.
There’s always a bull market here at The Bull Market Report! Want a free trial? Let us know! Let's get to work. It's going to be an interesting week.
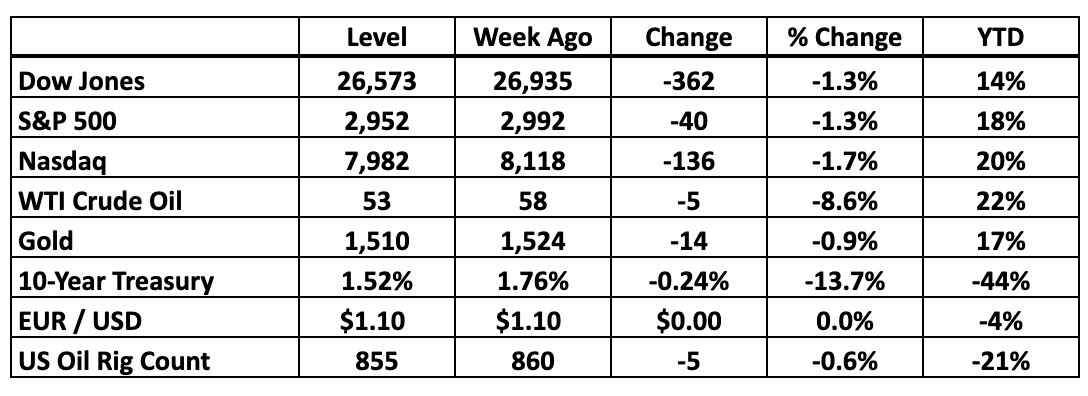
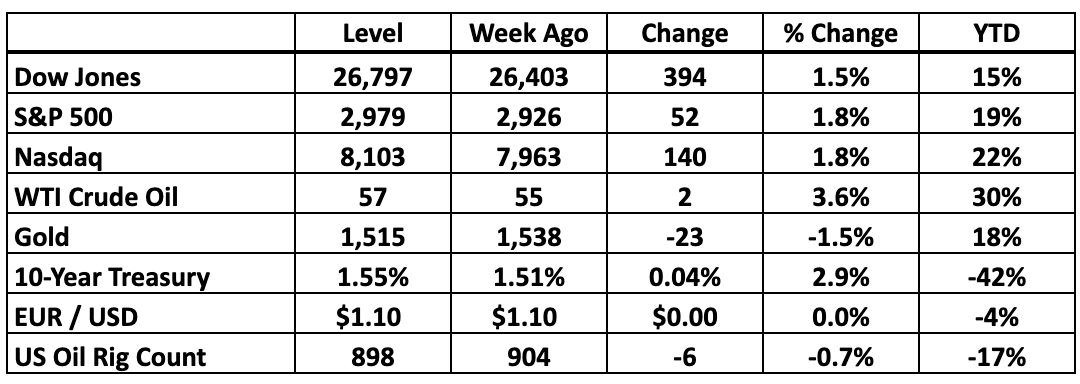
Key Market Indicators
-----------------------------------------------------------------------------
BMR Companies and Commentary
The Big Picture: Plenty Of Headroom Here
We talked a lot over the summer about the way corporate fundamentals still support further upside for the market as a whole. That math has not changed, so it’s no surprise that the S&P 500 is once again on the edge of record territory. And ironically enough, BMR stocks have even further to go before their earnings stretch logic to the limit.
The S&P 500 hit yet another record on Thursday and remains within 2% striking distance of that peak. That’s the good news. While it’s encouraging to see the market is still moving in the right direction, the gains have gotten slim when you balance the downswings against the rallies. All in all, from last year’s peak to now, index fund investors have a mediocre 3.7% to show for all the headaches along the way.
It’s not hard to understand their frustration. Money parked in one-year Treasury bills a year ago would have earned 2.6% with minimal risk, so these investors have effectively traded all those months of nerve wracking volatility for an extra 1% return on their money. Was it worth it? Another year of this will really test their patience.
However, BMR stocks have collectively rallied about 14% over the same period, so even though we’ve definitely felt the same volatility the market as a whole has had to absorb, our patience has at least earned a more significant reward. That’s the way the market is supposed to work. The secret is that the BMR universe has a lot more fundamental fire on its side.
After all, the S&P 500 has a sound reason to be roughly where it was a year ago. Back then, we were projecting forward earnings of about $173 for the index, which would have reflected close to 11% growth. Through all the angst about the yield curve and the trade war, we’re now looking at nearly $177 in S&P 500 earnings for next year, which is a little more than 10% growth.
Run all the numbers and the stocks that commanded a 17X earnings multiple then still rate the same multiple now. Almost identical fundamentals combined with an almost identical outlook justify almost identical valuations today. The only thing that’s changed is interest rates, which support another 3-4% upside for the S&P 500 every time the Fed relaxes. If that means another two rate cuts over the coming year, maybe those index fund investors will be able to look at their statements next September and cheer 12% returns over the trailing two-year period.
Our stocks will leave them in the dust. Part of what makes us so confident is the fact that while earnings for the broad market have stalled over the past year, the BMR universe kept expanding. Last quarter alone we saw 45% earnings growth across our portfolios. In the coming 3Q19 reporting cycle we’re looking for at least 10% growth to continue. That’s enough to keep stocks climbing at a healthy rate even if investors aren’t willing to embrace higher multiples.
If anything, all it takes is a shift back to historical multiples to give our stocks what they need to run a victory lap in the coming year. While the S&P 500 is now 1% below its peak, very few BMR recommendations are that close to straining their known limits. The exceptions are on the defensive side. Several of our REITs are only one good day from climbing to fresh peaks, and our High Yield portfolio is likewise within range of its best levels of the year.
But most BMR stocks are still a long way from their peaks. We estimate that even if they only revert to their recent highs our subscribers can add an easy 15% to the current score. That gives us plenty of headroom. Factoring in the Fed’s trajectory raises the ceiling from there.
Of course high multiples can always get compressed if investors lose their appetite for dramatic growth stories. That’s the case with a few of BMR stocks that dropped fast over the summer. [SUBSCRIBERS ONLY] supported an aggressive but justified 106X earnings multiple before its 2Q19 report. With revenue projections as strong as ever and the bottom line rising a little faster than expected, the company’s valuation has dropped to 76X earnings.
That’s extremely close to the 71X lower limit reached at the depths of last year’s correction. Unless the market has permanently abandoned the principle of paying more for faster growth, there’s no reason to suspect the stock will be stuck here long . . . especially with the Fed on the move. A year ago, interest rates were higher and the stock commanded a 125X multiple.
[SUBSCRIBERS ONLY] is a similar story. The people arguing so passionately that the stock is only worth $60 today think the stock is only worth 7X sales. We’ve seen that multiple swing from a 3X low back in December to as high as 18X a few weeks ago. The extreme might be too high to sustain, but it’s clearly within the realm of reason to see at least test that level again on the right turn of the market tide.
Meanwhile, every quarter beyond breakeven gives us a sense of how much the market will pay for every penny this company earns. The math naturally improves when you’re profitable. We suspect previous valuations are far from the ultimate limit here.
We could give you similar comparisons for our other high-growth recommendations, but relatively mature companies like [SUBSCRIBERS ONLY] provide the most compelling demonstration of all. When this was a $120 stock early in the summer, the market was willing to pay 40X earnings for a taste. Here at a 33X multiple, it’s like the clock wound back to February. And people who bought this stock in February are up 10% since then.
Stock after stock, the lesson is clear. As long as the fundamentals are progressing in line with expectations, any significant selling is a buy signal. Sooner or later, the market mood will swing and reflate the multiples to at least what we've seen in the past. We aren't assuming anything more aggressive than that to fuel continued outperformance.
NOTE: In our weekly paid subscription Newsletter, we do between 5 and 7 SnapShots and also support regular Research Reports. The last three stocks we recommended are already up 5% apiece. Plus, we have the Weekly High Yield Investor, whereby we discuss the 17 stocks in our High Yield and REIT Portfolios.
And to top it all off, we send News Flashes each day during the week. Got a question about any stock on the market? We'll answer. So if your favorite stock reports earnings or there is significant news, you will hear about it here first. If you want the whole picture, join the thousands of Bull Market Report readers who are making money in the stock market and subscribe here:
www.BullMarket.com/subscription
It’s only $249 a year, and later this year we will be raising it to $499 or even $999 a year, it is just THAT valuable. But we will lock you in for life at this lower price.
Good Investing,
Todd Shaver, Founder and CEO
The Bull Market Report
Since 1998
Subscribe HERE:
www.BullMarket.com/subscription
Just $249 a year, soon to go up to $499. But you are guaranteed the SAME PRICE forever.

by Scott Martin | Sep 16, 2019 | Free Newsletter (Sent Weekly Monday at 12pm)
The Weekly Summary
Every so often, investors benefit from a simple gut check. When our stocks are going up, it's nice to verify that the gains are truly justified and there's room for more upside when the market winds blow in the right direction. And when our stocks go down, it's even more important to make sure that it's just the wind and not something fundamentally wrong with the underlying business or our calculations.
That's the kind of week it's been for us. While the S&P 500 kept climbing, the high-growth stocks that dominate our universe took a significant step back after months of outperformance. The Aggressive group dropped 9% and our High Technology portfolio fell 5%, overcoming mild strength elsewhere. Simultaneously, the recent flight to dividend stocks unwound as hints of inflation softened the Fed rate cut outlook, taking our REIT and Healthcare recommendations with it. Caught between the frying pan and the fire, the BMR universe as a whole took a step back to regroup.
We're still up 35% YTD compared to a 21% gain for the market as a whole. The High Technology group is still up a breathtaking 75% YTD. We aren't crying. With that level of outperformance, our stocks have plenty of cushion to absorb a few percentage points worth of reversal. Nonetheless, it's prompted a lot of rechecking throughout our portfolios. You're seeing the first results of that new round of analysis here. So far, we see no reason to change course.
But it's worth reflecting a bit on the change in the market weather. Almost exactly a year ago, warnings from Big Tech companies like Apple and Amazon triggered what eventually became a full-fledged 20% market slide. It took a full 12 months for the S&P 500 to recover its record-breaking nerve and get back to the age-old job of conquering new peaks.
Of course back then interest rates were moving up instead of down. Otherwise, the only thing that's really changed is that investors have now tolerated a full year of volatility, twisted Treasury yields, trade war and flat corporate earnings. The question now is how far their patience will stretch before they need proof of better times ahead.
From what we've seen, it can stretch a long way, especially with other asset classes yielding less than what ambient inflation steals from purchasing power in a typical year. Bonds, cash and gold are safe but don't offer the upside that stocks, despite their risk, offer in the long term. And as a result, we suspect we'll see money keep coming in from the sidelines to keep the stock rally alive, even if it's on a stop-and-start basis until positive catalysts emerge.
The Fed has become one of those catalysts. The next rate policy meeting ends on Wednesday and we're expecting at least a 0.25% cut. From there, we aren't ruling anything out. Odds are good Jay Powell and his fellow central bankers are in a similar position. They're watching the economy and the market. If it looks like the mood needs a little support, they're in a place where they can provide it.
We may need that support in the coming week if Saudi oil distribution remains shut down for long. Drone attacks on a key field have taken 5.7 million barrels a day out of the global supply chain, reducing the amount of petroleum available by 5% . . . roughly what Iran and Iraq pump together. Oil futures are soaring. We're pleased that we've remained bullish on [SUBSCRIBERS ONLY] for moments like this. Whatever happens, that fund should be a ray of light until the market mood improves.
There’s always a bull market here at The Bull Market Report! Want a free trial? Let us know! Let's get to work. It's going to be an interesting week.
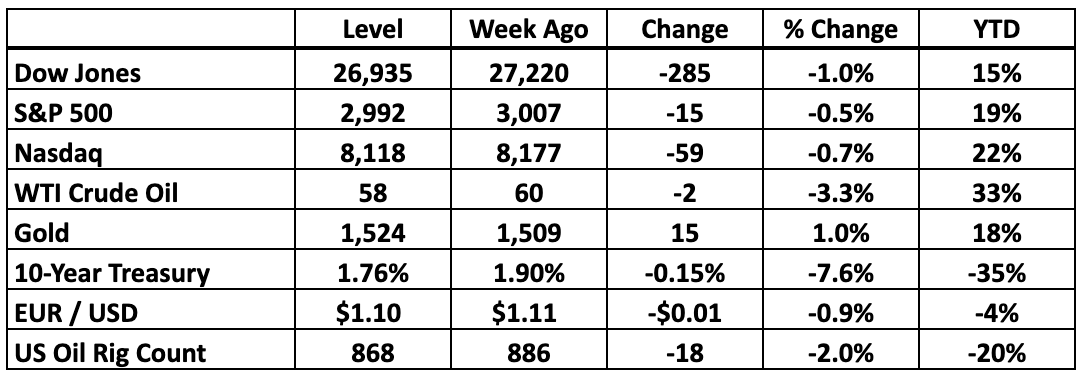
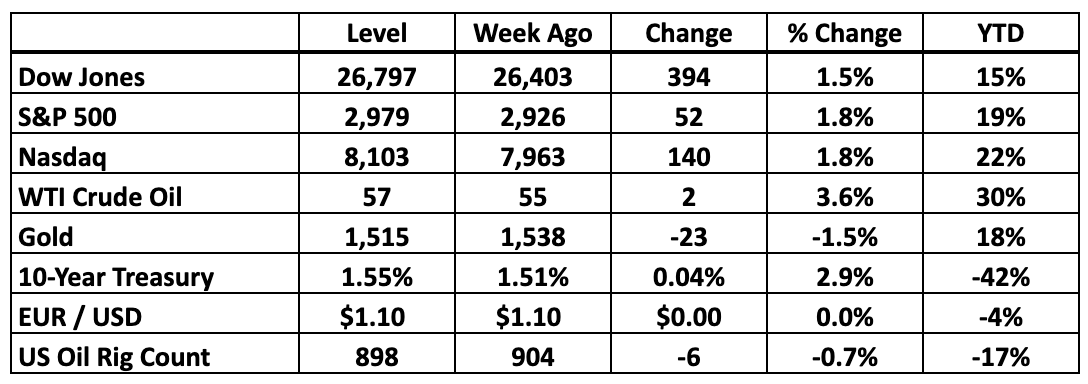
Key Market Indicators
-----------------------------------------------------------------------------
BMR Companies and Commentary
The Big Picture: Short Sellers Take Cover
We discussed the market’s strategic gyrations in recent morning News Flashes but want to highlight a few of the most specific swings in sentiment around the stocks we recommend. After all, when money reverses direction for no clear reason, investors need to look deeper to determine whether the core proposition has shifted or just the market weather.
Only five BMR companies missed our earnings target last quarter. They’re up an average of 5% since releasing their numbers, so clearly there’s no direct correlation between fundamental disappointment and the direction stocks move in response. In fact, the BMR stocks that beat our forecasts actually dropped a little this season in line with the market as a whole.
Likewise, hitting the mark on revenue made no real difference in terms of the direction our stocks have moved this season. And in most cases, guidance for the coming quarterly confession cycle has held up better than usual. Strong stocks are getting stronger, but the highest flyers spent the last month under a cloud all the same.
Part of the pressure on these companies is pure macroeconomic dread. The recession narrative exploded last month as hedge fund algorithms interpreted the inverting yield curve as an automatic contraction signal, triggering liquidation of speculative positions as portfolio managers shifted into more secure postures. Suddenly growth fell from favor, taking many BMR stocks along with it.
A look at [SUBSCRIBERS ONLY] reveals what’s going on here. The growth outlook for this company has not changed and unless you assume that the global economy is going over a cliff, management is still on track to turn what we suspect will be 35% revenue growth next year into at least 65% earnings expansion. None of the dozen big Wall Street banks that track the stock have concluded that growth profile has flattened out one bit. If anything, they still tell their clients this stock is worth at least $140.
And yet that math no longer stretches the way it did a week ago when this was indeed a $145 stock. What’s changed is investors’ comfort with paying up to 190X earnings or 19X revenue for a company growing this fast. Again, cash flow shows no sign of deterioration but after the recent selloff this and similar stocks have cooled down dramatically from the “price” end of the price-per-earnings or price-per-sales calculations.
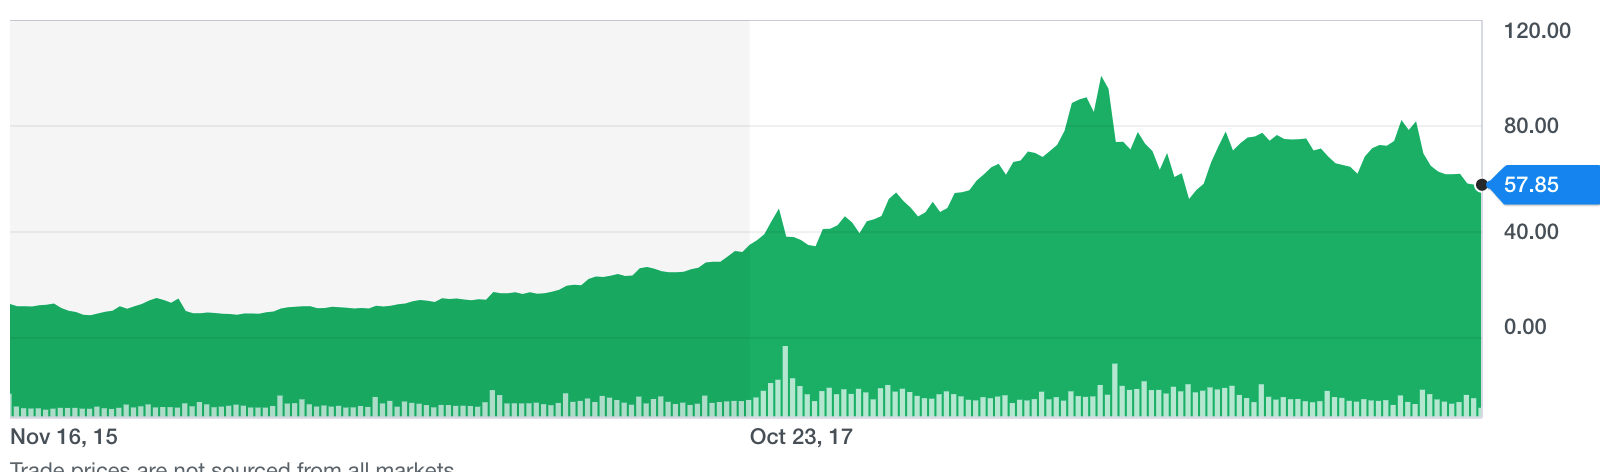
We see this as just another turn in the market weather. When the sentimental pendulum swings back, this company can command at least $145 again and investors who buy the dip will be happy. But in the meantime, BMR subscribers have done extremely well here, so even if this correction continues for weeks or even months, there’s little reason to complain. This was a $58 stock when we added it to our Buy List back in November. It’s still up nearly 90% this year alone.
For now, however, the short sellers will remain in control until they realize they’ve run out of rope. Short interest here has climbed to 11% of the stock, which means that sooner or later those investors need to commit $735 million to cover their positions and take their money. If they can’t do it gradually, they’ll need to do it fast, which raises the prospect of a squeeze if the stock starts moving up this week.
Quite a few of our recommendations are in a similar situation right now. We’d point to aggressive growth stories that have faced fierce headwinds after reporting perfectly reasonable 2Q19 numbers. It’s no coincidence that short sellers have committed to buy 9-11% of each stock, so there’s no reason for us to liquidate our positions here and make their victory any easier.
And then there’s [SUBSCRIBERS ONLY], where short interest has swelled to a huge and unsustainable 15% of the overall company. Institutional investors own 15% of the stock so even small positions like ours can make a difference in whether the shorts get what they need. If we hold on, we’ll see more sudden moves to the upside to balance the pain we’ve absorbed recently . . . and then the stocks will get back to work.
After all, these six stocks are still up an average of 30% YTD, beating the S&P 500 by 10 percentage points. We're the ones in a position of strength, and judging from the wild rebound [SUBSCRIBERS ONLY] launched last week, the short sellers should be the ones who are nervous. If you've been looking for a chance to expand your holdings of any of these stocks, now is the time. Remember, if the fundamental picture changes, we'll tell you. And unless that picture changes, it's just the wind blowing against extremely constructive cash flow trends.
NOTE: In our weekly paid subscription Newsletter, we do between 5 and 7 SnapShots and also support regular Research Reports. The last three stocks we recommended are already up 5% apiece. Plus, we have the Weekly High Yield Investor, whereby we discuss the 17 stocks in our High Yield and REIT Portfolios.
And to top it all off, we send News Flashes each day during the week. Got a question about any stock on the market? We'll answer. So if your favorite stock reports earnings or there is significant news, you will hear about it here first. If you want the whole picture, join the thousands of Bull Market Report readers who are making money in the stock market and subscribe here:
www.BullMarket.com/subscription
It’s only $249 a year, and later this year we will be raising it to $499 or even $999 a year, it is just THAT valuable. But we will lock you in for life at this lower price.
Good Investing,
Todd Shaver, Founder and CEO
The Bull Market Report
Since 1998
Subscribe HERE:
www.BullMarket.com/subscription
Just $249 a year, soon to go up to $499. But you are guaranteed the SAME PRICE forever.
by Scott Martin | Sep 9, 2019 | Free Newsletter (Sent Weekly Monday at 12pm)
The Weekly Summary
The week after a market holiday is usually frenetic and this one was no exception, packing at least five days of volatility into an abbreviated calendar. Relief was the strongest note driving the S&P 500 and our stocks up close to 2%, with news that China has agreed to participate in trade negotiations in October cutting through the global clouds.
Closer to home, August job creation numbers were decent . . . a little lower than some hoped, but well within the range that usually reflects an ongoing economic expansion. We're a long way from recession territory even though corporate hiring plans remain on hold while the world waits for the trade war to resolve. In the meantime, any slippage in the job market will strengthen the Federal Reserve's argument to keep lowering interest rates in the absence of inflation.
We're less than 10 days from the next Fed meeting now. If we get the 0.25% cut most investors expect, it probably translates into roughly a 3.5% bump up for the S&P 500. Catch the market mood in the right place and that's going to take stocks back to record levels. It's hard to complain about that.
There’s always a bull market here at The Bull Market Report! Want a free trial? Let us know!
Key Market Indicators
-----------------------------------------------------------------------------
BMR Companies and Commentary
The Big Picture: The Sector Map Spins
With earnings stalled across the S&P 500 as a whole for the past nine months, most of the market activity this year is best interpreted as Wall Street’s effort to pivot to match changing investment priorities. Popular growth sectors are currently out of favor as their expansion hits a wall. And with defensive themes already looking rich, there isn’t a lot of “value” around in the traditional sense.
However, a month from now the pendulum can easily swing again, pulling cash away from today’s hot spots and pushing it back into areas of the market that don’t look attractive at all. We’ve seen it play out again and again over the year so far and will undoubtedly see the cycle continue until clear leadership emerges.
Cut through the cycle and one thing is clear. Investors fleeing declining yields in the bond market are hunting replacements for lost income, parking money in dividend-paying stocks instead of rolling it into newly issued Treasury debt. They don’t want to take on a lot of additional risk in the process, so only the safest economic havens have benefited.
Over the last 12 months, the Utilities are up 15%, which is a staggering rally for a sector that rarely moves at all. We haven’t bothered with these stocks for two reasons. First, our more growth-oriented recommendations have done much better. Second, the Utilities don’t actually pay much. Dividends across the sector only added up to 4% a year ago and now that the stocks have rallied they don’t even pay 3% a year. That’s not worth locking in.
Similar logic carries to the Consumer Staples and Real Estate sectors, both of which have rallied 13% over the last 12 months. We love Real Estate because the yields tend to be much higher and a year ago the stocks were deeply depressed. Where are the REIT bears now? We don’t hear them.
Otherwise, it’s been a dull year for the market. Technology has gained ground because that’s where the long-term growth is. Consumer Discretionary stocks have also done well because that’s where Amazon is. And Communications is all about Social Media stocks recovering from a terrible 1H18. Healthcare, Materials, Industrials, Financials and especially Energy have all suffered.
Again, this isn’t about relative growth or value. Healthcare, for example, had a huge 2Q19, with the sector as a whole reporting 9% stronger earnings than what we saw the previous year. That’s usually a catalyst to push the stocks into a rally. This time around, the group went nowhere. The Financials told a similar story.
For the long term, the Financials are also extremely attractive on a pure earnings basis. The big Banks and Insurance carriers are still growing at a healthy 5% rate, but as long as the yield curve is unsettled few investors want to go near the stocks. The sector barely commands a 13X earnings multiple now, half what we see in most other areas of the market. Energy doesn’t look much stronger. They’ll recover, but until they do, we see little point in widening our sector-weight Special Opportunities exposure to either group, no matter how “cheap” they look today. (We’re not fond of that word.)
So what does this mean? If you tried to capture growth this year on a sector level, you’ve been disappointed. Our strategy of selecting the right stocks regardless of sector has paid off a lot better. BMR recommendations have climbed 20% over the past 12 months. And while we're heavy on Technology, that sector as a whole has been no prize. Going all over the market map has given us the freedom to outperform. We're looking forward to more, even if the market as a whole keeps grinding its gears.
There’s always a bull market here at The Bull Market Report! Want a free trial? Let us know!
NOTE: In our weekly paid subscription Newsletter, we do between 5 and 7 SnapShots and also support regular Research Reports. The last three stocks we recommended are already up 5% apiece. Plus, we have the Weekly High Yield Investor, whereby we discuss the 17 stocks in our High Yield and REIT Portfolios.
And to top it all off, we send News Flashes each day during the week. Got a question about any stock on the market? We'll answer. So if your favorite stock reports earnings or there is significant news, you will hear about it here first. If you want the whole picture, join the thousands of Bull Market Report readers who are making money in the stock market and subscribe here:
www.BullMarket.com/subscription
It’s only $249 a year, and later this year we will be raising it to $499 or even $999 a year, it is just THAT valuable. But we will lock you in for life at this lower price.
Good Investing,
Todd Shaver, Founder and CEO
The Bull Market Report
Since 1998
Subscribe HERE:
www.BullMarket.com/subscription
Just $249 a year, soon to go up to $499. But you are guaranteed the SAME PRICE forever.